Fig. 23.
Download original image
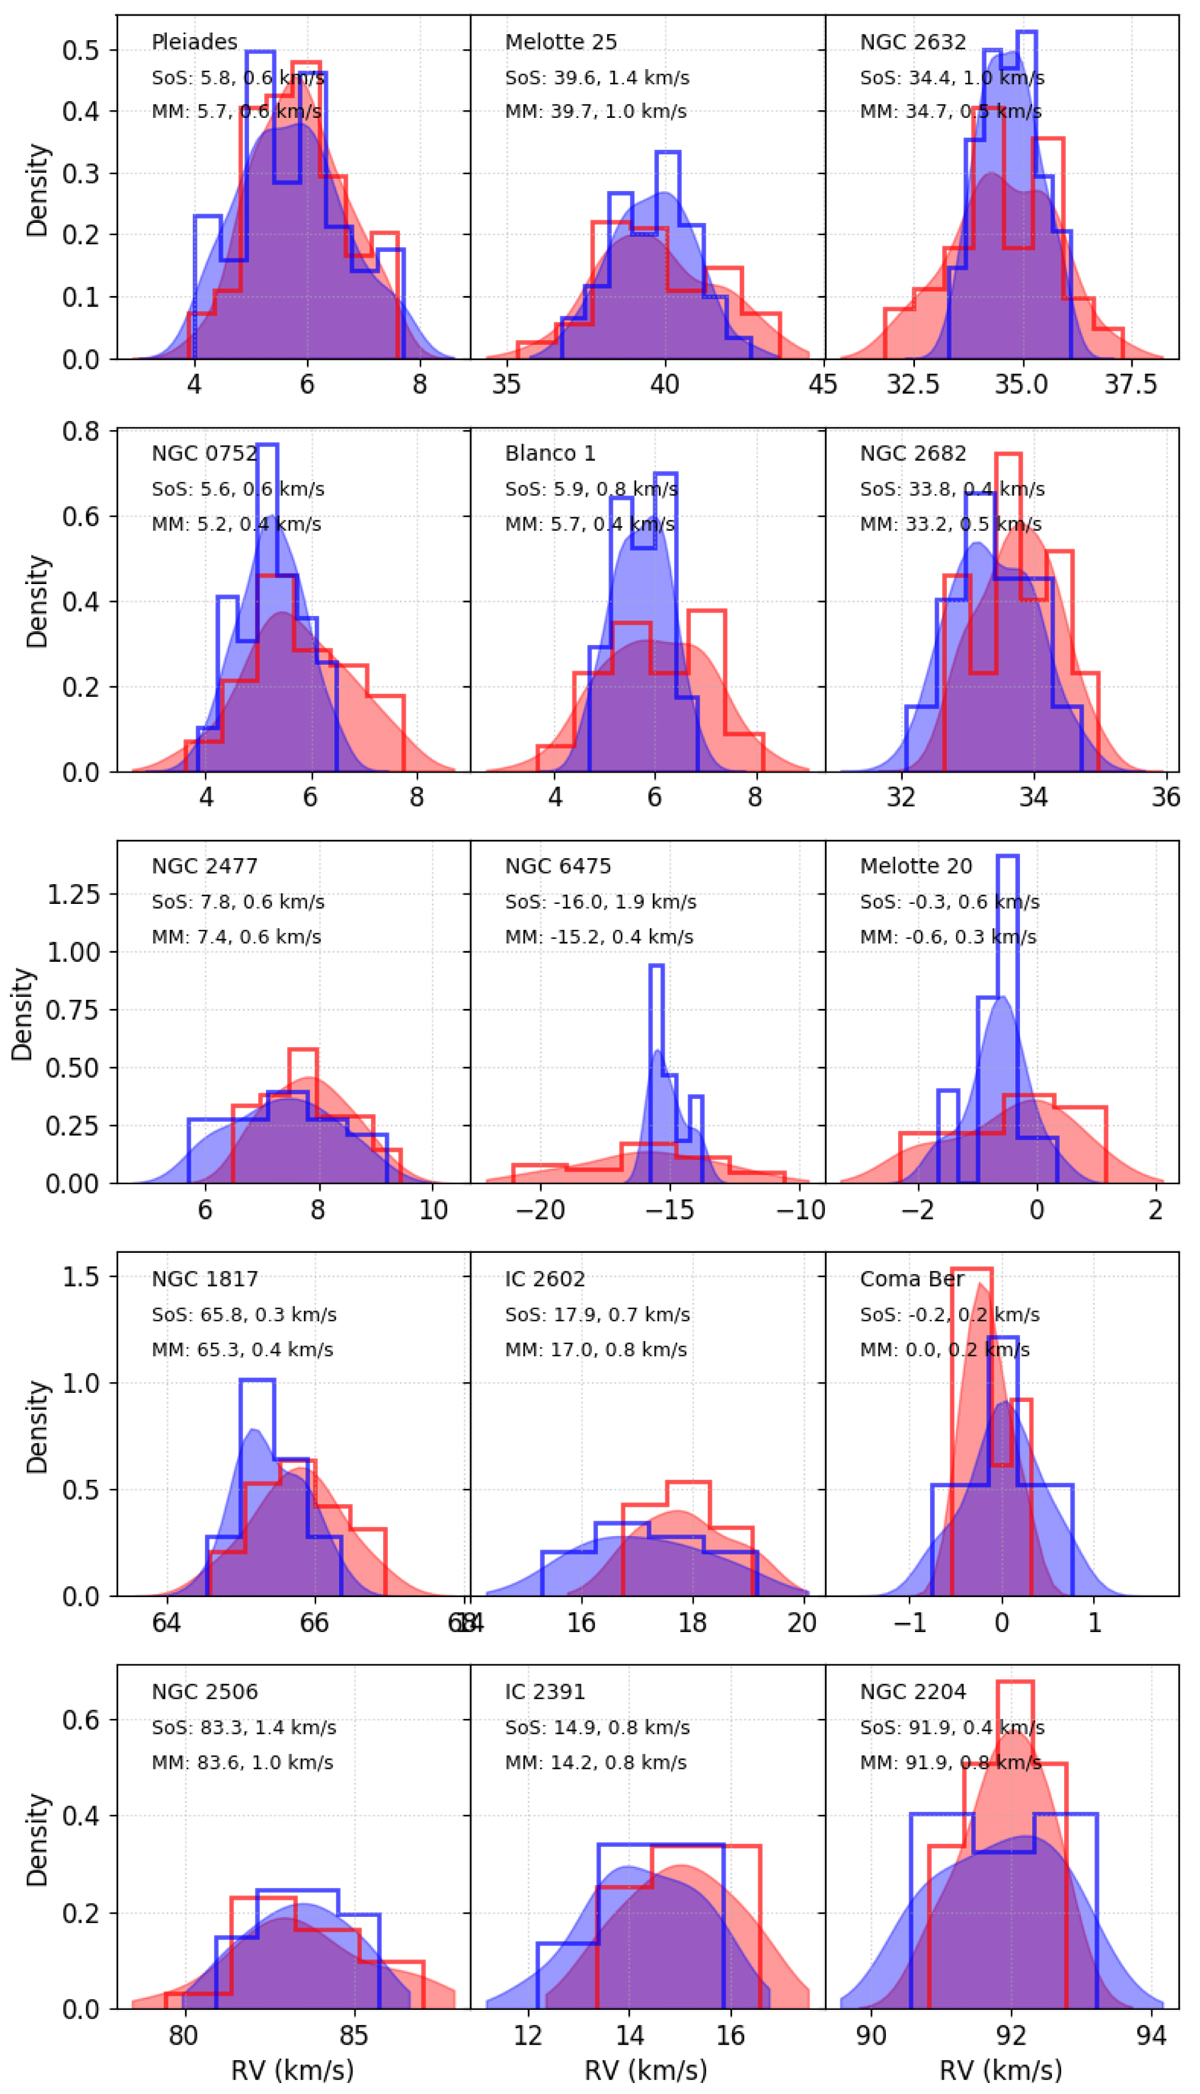
RV distributions of 15 clusters from Mermilliod et al. (2008, 2009) with more than 15 stars. Red histograms represent the SoS results and blue the literature. The Gaussian kernel-density estimate is plotted as shaded areas. There is also the information on the median and MAD values after the 3σ outlier removal for both samples.
Current usage metrics show cumulative count of Article Views (full-text article views including HTML views, PDF and ePub downloads, according to the available data) and Abstracts Views on Vision4Press platform.
Data correspond to usage on the plateform after 2015. The current usage metrics is available 48-96 hours after online publication and is updated daily on week days.
Initial download of the metrics may take a while.