Free Access
Fig. 22.
Download original image
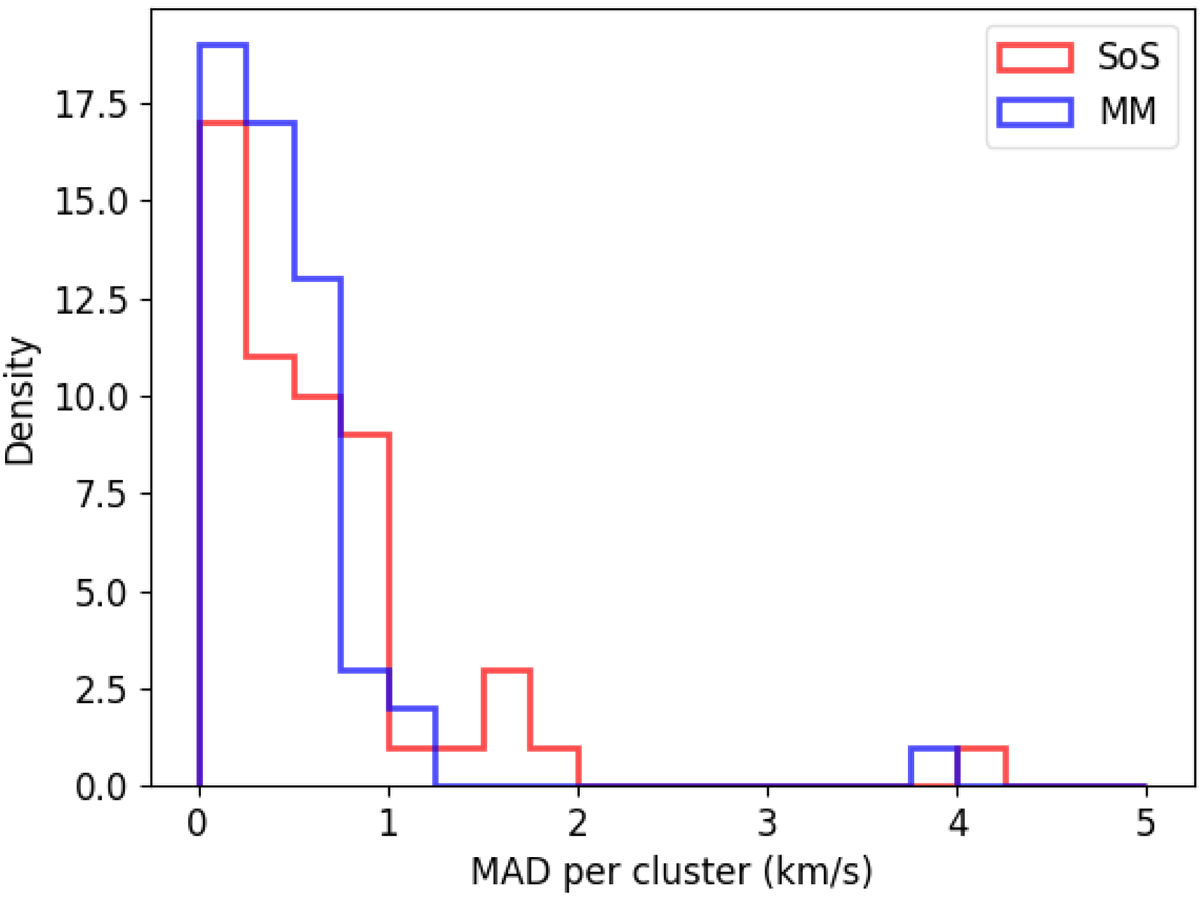
Distribution of the MAD of the RVs derived from SoS in red and Mermilliod et al. (2008, 2009) in blue for the 55 clusters. The OCs contain more than 3 stars and the MAD is calculated after a 3σ outlier removal for both samples.
Current usage metrics show cumulative count of Article Views (full-text article views including HTML views, PDF and ePub downloads, according to the available data) and Abstracts Views on Vision4Press platform.
Data correspond to usage on the plateform after 2015. The current usage metrics is available 48-96 hours after online publication and is updated daily on week days.
Initial download of the metrics may take a while.