Free Access
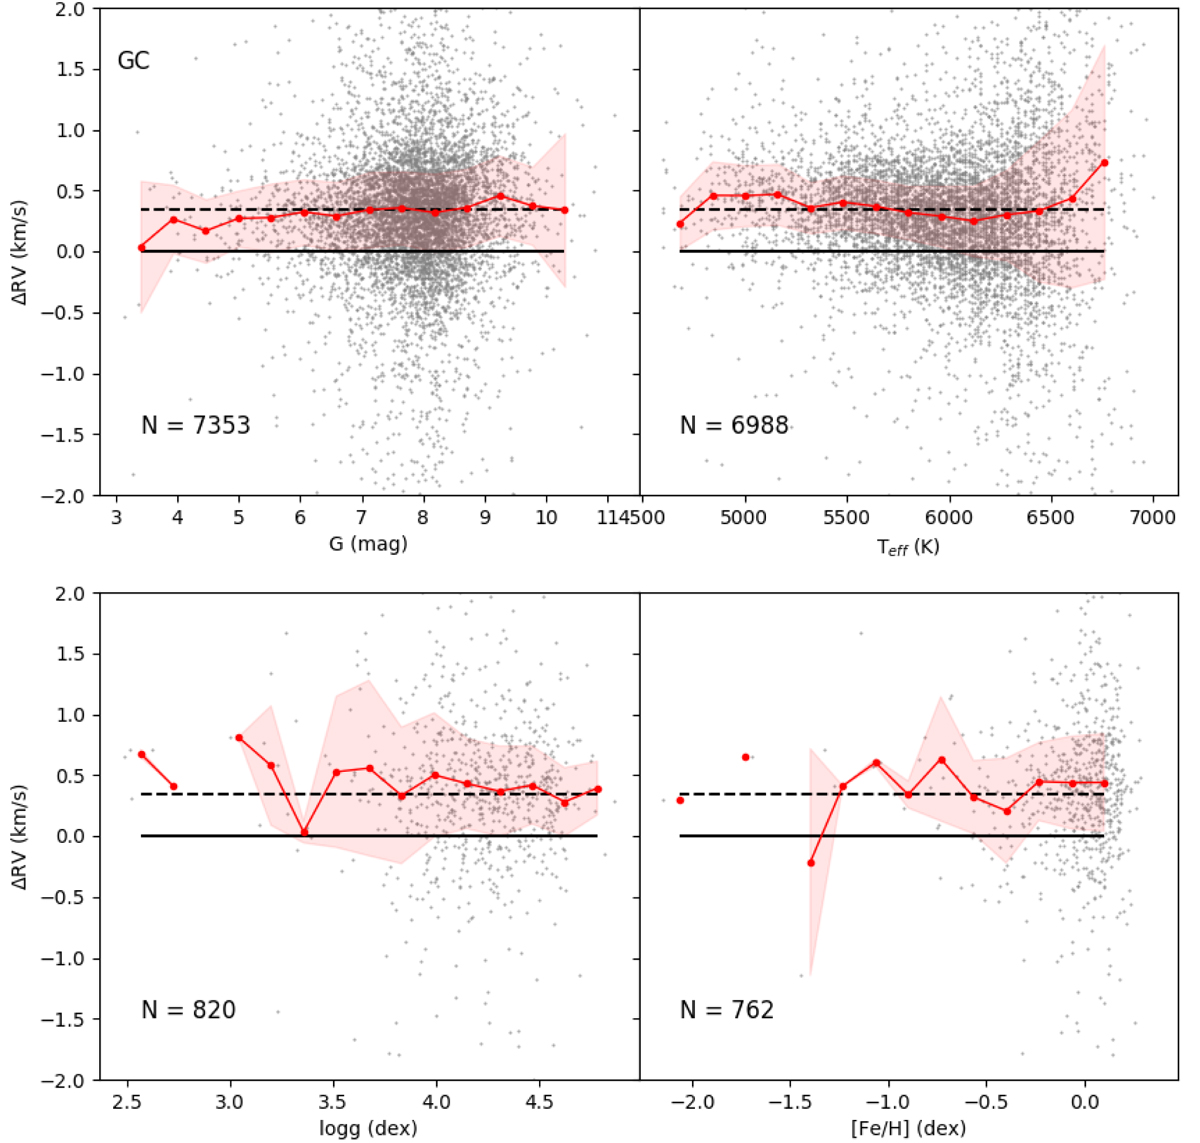
Fig. 20.
Download original image
RV comparison between SoS and the GC survey as a function of magnitude, Teff, log g, and [Fe/H]. The red points are the median binned values and the shadowed area the MAD of each bin. The dashed line is their median difference.
Current usage metrics show cumulative count of Article Views (full-text article views including HTML views, PDF and ePub downloads, according to the available data) and Abstracts Views on Vision4Press platform.
Data correspond to usage on the plateform after 2015. The current usage metrics is available 48-96 hours after online publication and is updated daily on week days.
Initial download of the metrics may take a while.