Fig. 9.
Download original image
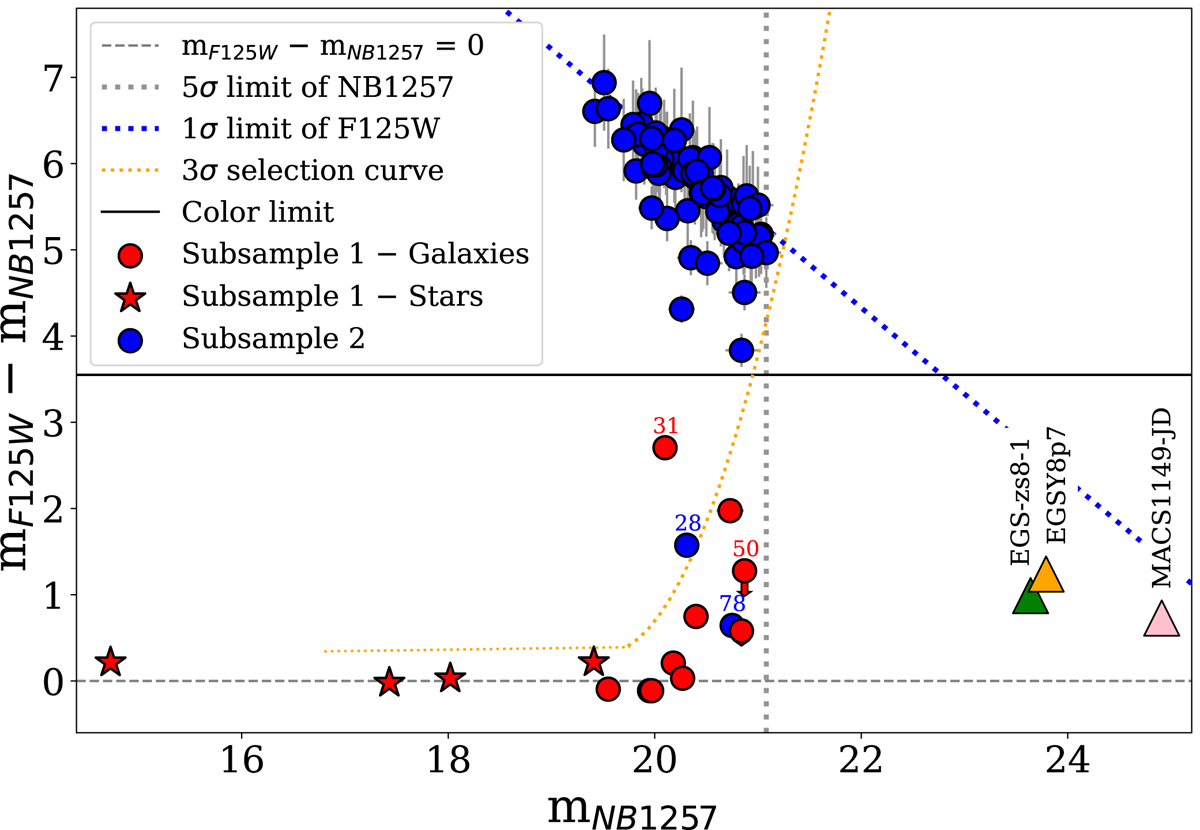
Color-magnitude diagram of the final sample with magnitudes measured within 0.8″ radius apertures. Red symbols indicate the position of subsample 1 (objects with an HST counterpart): filled circles and stars represent the galaxies and stars, respectively. Blue circles represent subsample 2 (objects without HST counterpart). The solid horizontal black line shows the upper limit to the color produced by an emission line. The dotted orange line is the selection curve with a level of significance of nσ = 3.0 (Pascual et al. 2007). The 5σ (1σ) limiting magnitude in the NB1257 (F125W) filter is marked with a vertical dotted gray (diagonal blue) line. The position that the very high-z galaxies EGSY8p7 (Zitrin et al. 2015), EGS-zs8-1 (Oesch et al. 2015), and MACS1149-JD (Hashimoto et al. 2018) would have in our color-magnitude diagram is plotted with an orange, green, and pink triangle respectively. The dashed horizontal gray line marks the mF125W − mNB1257 = 0 reference to guide the eye. The identification number of some objects (discussed in more detail in the text) is provided. The red arrows indicate the color of the sources in subsample 1 using the centroid of the objects in the F125W image instead of the position of the NB1257 detections to measure the BB fluxes. The arrow is discernible only for the faintest source.
Current usage metrics show cumulative count of Article Views (full-text article views including HTML views, PDF and ePub downloads, according to the available data) and Abstracts Views on Vision4Press platform.
Data correspond to usage on the plateform after 2015. The current usage metrics is available 48-96 hours after online publication and is updated daily on week days.
Initial download of the metrics may take a while.