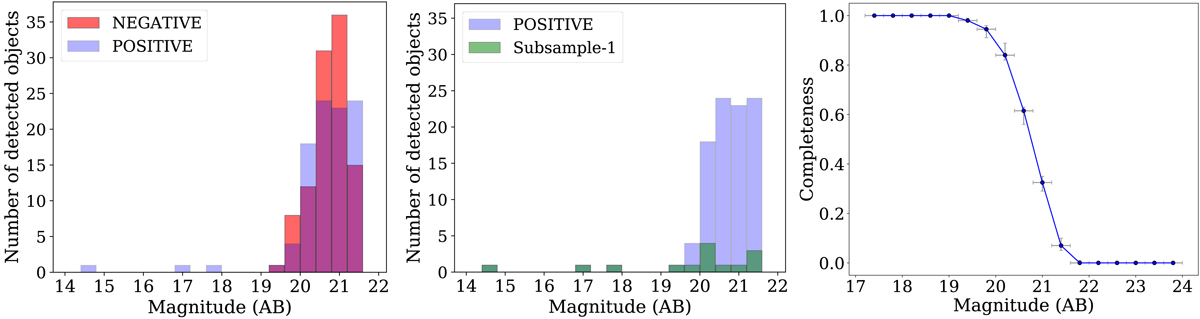
Fig. 8.
Download original image
Contamination and completeness levels. Left panel: NB magnitude histogram of objects detected in the negative image (red bars) and in the positive science image (purple bars). Middle panel: histogram with the number of objects detected in the positive science image (purple bars) and the number of them that are already identified objects at lower redshifts (subsample 1, green bars). Right panel: completeness levels as a function of AB magnitude with bins of 0.4 mag. The error bars in the vertical axis represent the 16th and 84th percentiles of the distributions obtained from the simulations.
Current usage metrics show cumulative count of Article Views (full-text article views including HTML views, PDF and ePub downloads, according to the available data) and Abstracts Views on Vision4Press platform.
Data correspond to usage on the plateform after 2015. The current usage metrics is available 48-96 hours after online publication and is updated daily on week days.
Initial download of the metrics may take a while.