Fig. 7.
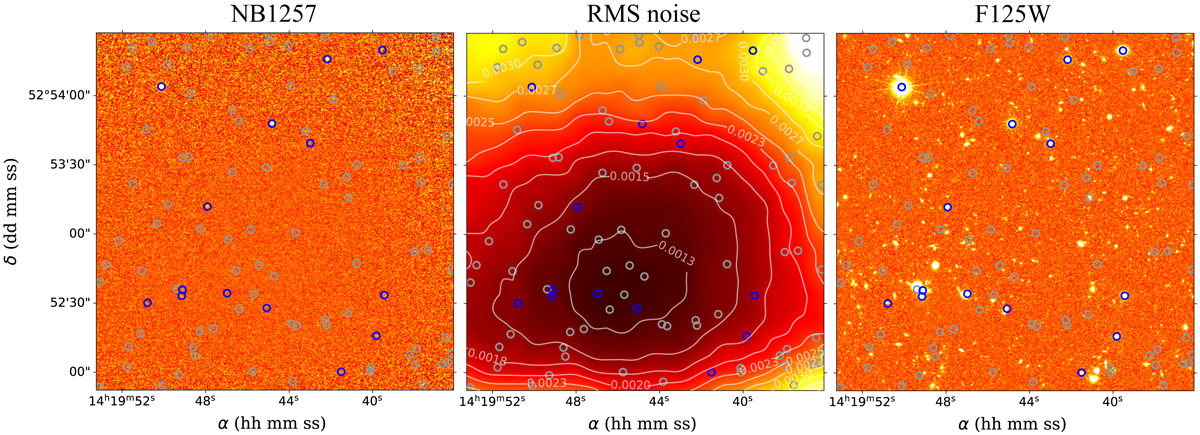
Download original image
Field of view within the EGS field. The positions of the detections are plotted with open circles: blue for already identified objects at lower redshifts (subsample 1) and gray for sources without an HST counterpart (subsample 2). Left panel: GTC/CIRCE deep image (NB1257 filter) with 18.3 h of exposure time. Middle panel: RMS noise contour map of the NB1257 image in ADU/s. Right panel: HST/WFC3 image (F125W filter) with 25.9 h of exposure time. Orientation: North is up, and east is to the left. Size: 2.6 × 2.6 arcmin2.
Current usage metrics show cumulative count of Article Views (full-text article views including HTML views, PDF and ePub downloads, according to the available data) and Abstracts Views on Vision4Press platform.
Data correspond to usage on the plateform after 2015. The current usage metrics is available 48-96 hours after online publication and is updated daily on week days.
Initial download of the metrics may take a while.