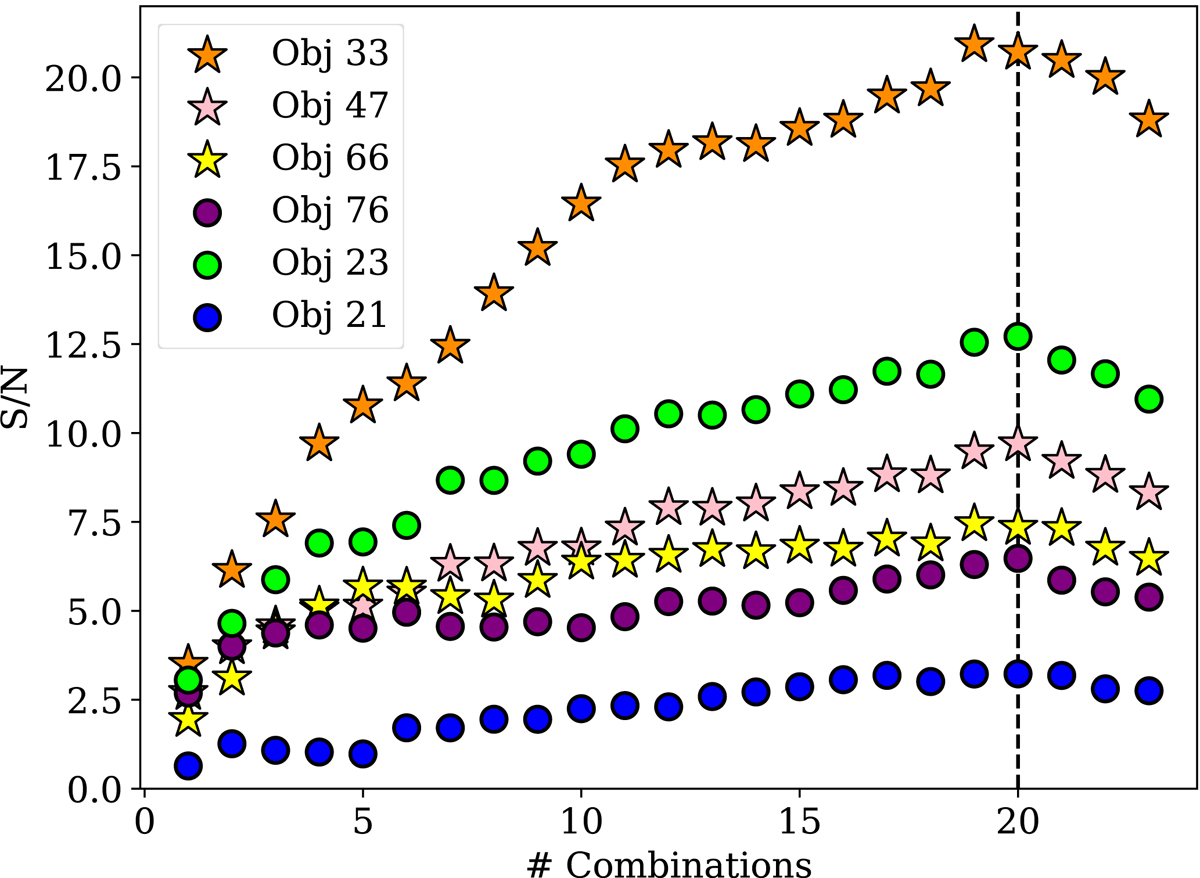
Fig. A.2.
Download original image
Variation in S/N according to the number of OBs included in the combination. Filled circles and stars represent the relatively bright galaxies and stars we analyzed, respectively. Different colors stand for different objects. The dashed vertical black line indicates the optimum number of OBs that was used in the final combination.
Current usage metrics show cumulative count of Article Views (full-text article views including HTML views, PDF and ePub downloads, according to the available data) and Abstracts Views on Vision4Press platform.
Data correspond to usage on the plateform after 2015. The current usage metrics is available 48-96 hours after online publication and is updated daily on week days.
Initial download of the metrics may take a while.