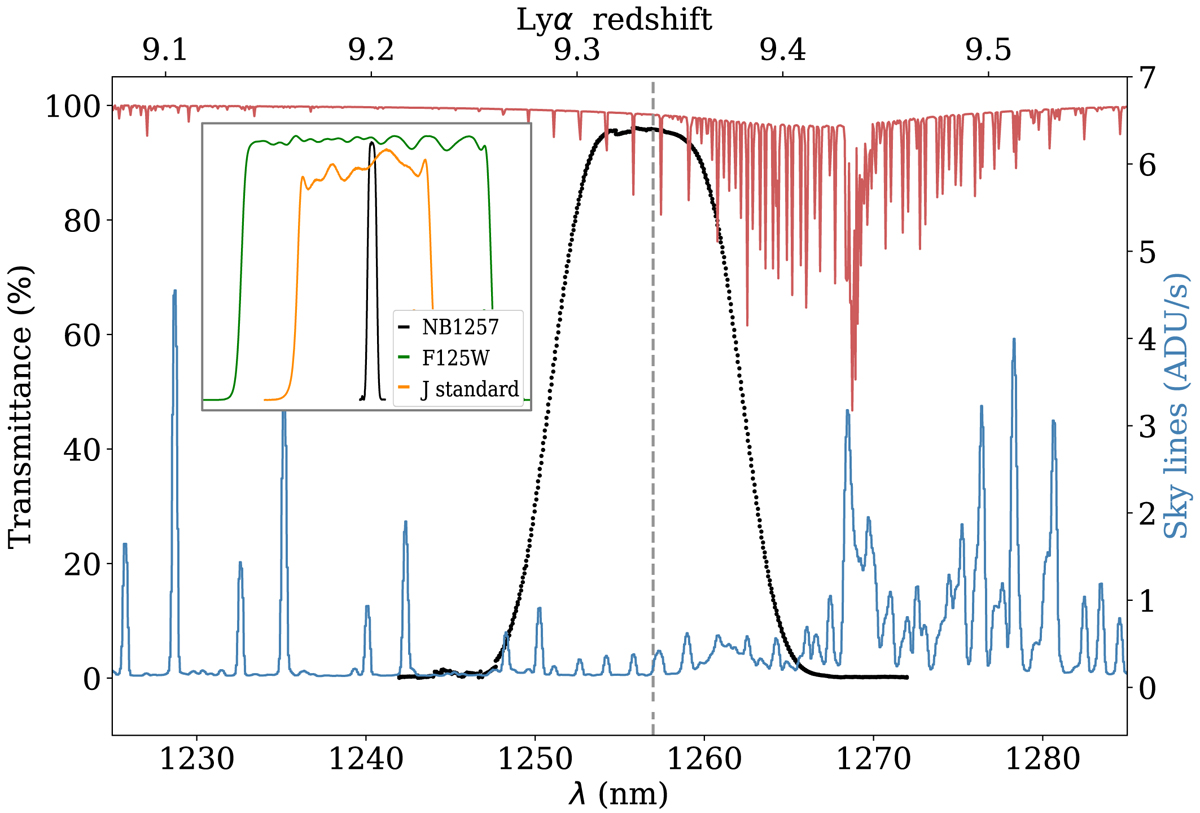
Fig. 1.
Download original image
Transmission curve of the NB1257 filter. The black dots show the empirical profile measured in the laboratory to guarantee FWHM = 11 nm and central wavelength λc = 1.257 μm (dashed vertical gray line) at cryogenic temperature. The sky emission of La Palma is overplotted in blue. This sky spectrum was obtained with the EMIR instrument at the GTC. The atmospheric absorption was computed based on the Cerro Paranal Advanced Sky Model and is plotted in red. The filter lies in a wavelength range with minimum sky continuum emission and OH emission of the atmosphere. The inset shows the comparison between the transmission curve of our NB1257 filter (solid black line) and the BB filters WFC3/F125W (solid green line) and J standard (solid orange line) from the Maunakea set of filters.
Current usage metrics show cumulative count of Article Views (full-text article views including HTML views, PDF and ePub downloads, according to the available data) and Abstracts Views on Vision4Press platform.
Data correspond to usage on the plateform after 2015. The current usage metrics is available 48-96 hours after online publication and is updated daily on week days.
Initial download of the metrics may take a while.