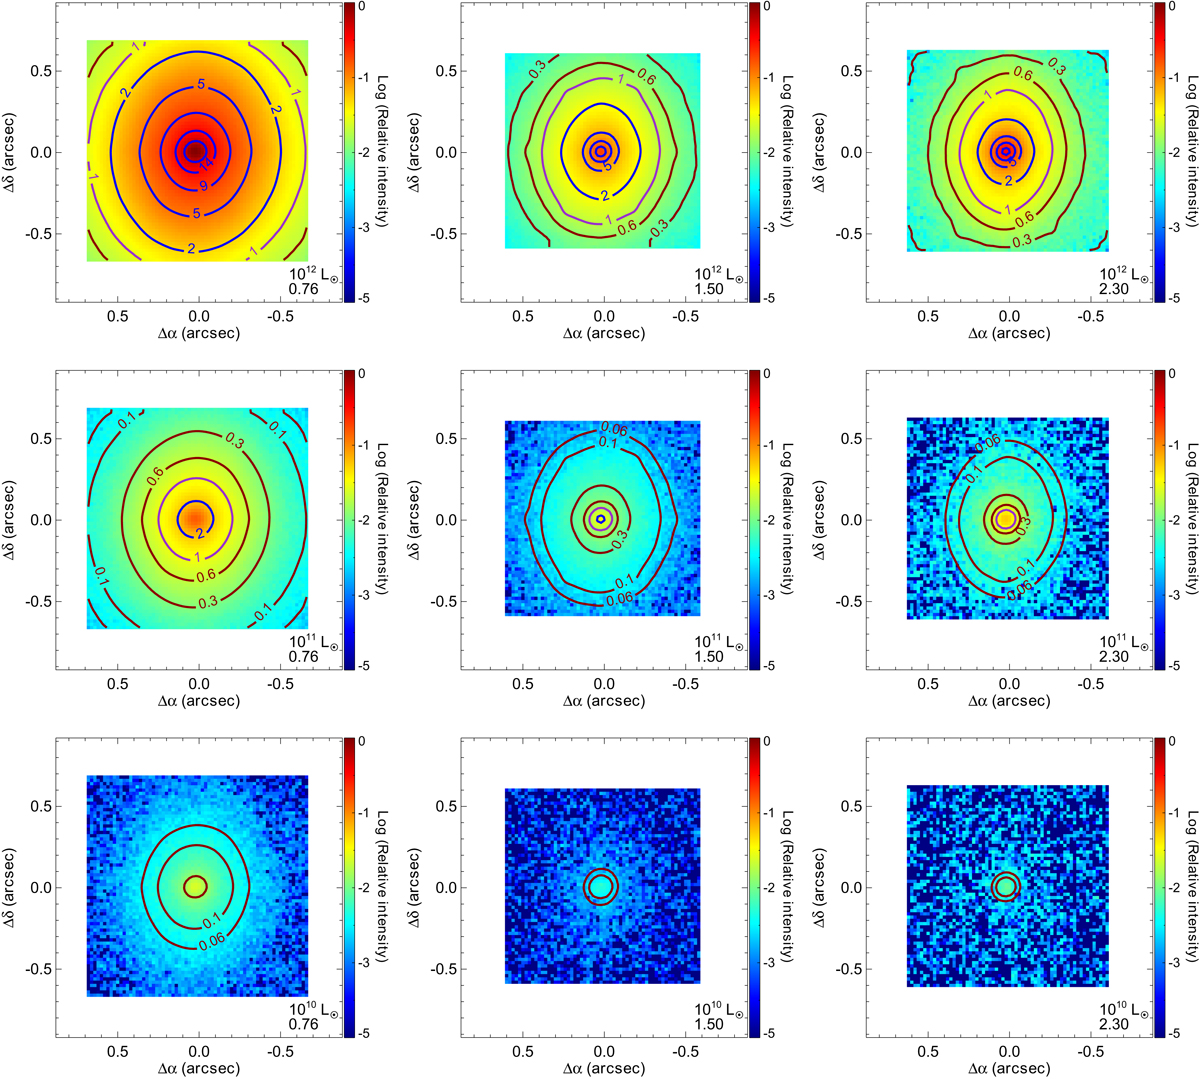
Fig. 8.
Download original image
Full-band images obtained by integrating the signal of the HSIM output cubes in the spectral band of the IzJ (left and central; 0.81−1.34 μm) and the H + K (right; 1.45−2.40 μm) gratings when considering the lenticular host (i.e. NGC 809) as a galaxy at redshifts 0.76 (left), 1.50 (middle), and 2.30 (right) scaled to 1012 Lv, ⊙ (top), 1011 Lv, ⊙ (middle), and 1010 Lv, ⊙ (bottom) as also labelled in each panel. Intensity is in logarithmic scale and normalised to the peak of the brightest case (top left panel). As in Figs. 6 and 7, contours correspond to the average S/N in the rest-frame 5050−5250 Å (black contours are S/Ns of 0.06, 0.1, 0.3, and 0.6; S/N values of 2, 5, 9, 14, and 20 are drawn as blue contours; the purple contour indicates an S/N of 1).
Current usage metrics show cumulative count of Article Views (full-text article views including HTML views, PDF and ePub downloads, according to the available data) and Abstracts Views on Vision4Press platform.
Data correspond to usage on the plateform after 2015. The current usage metrics is available 48-96 hours after online publication and is updated daily on week days.
Initial download of the metrics may take a while.