Fig. 9
Download original image
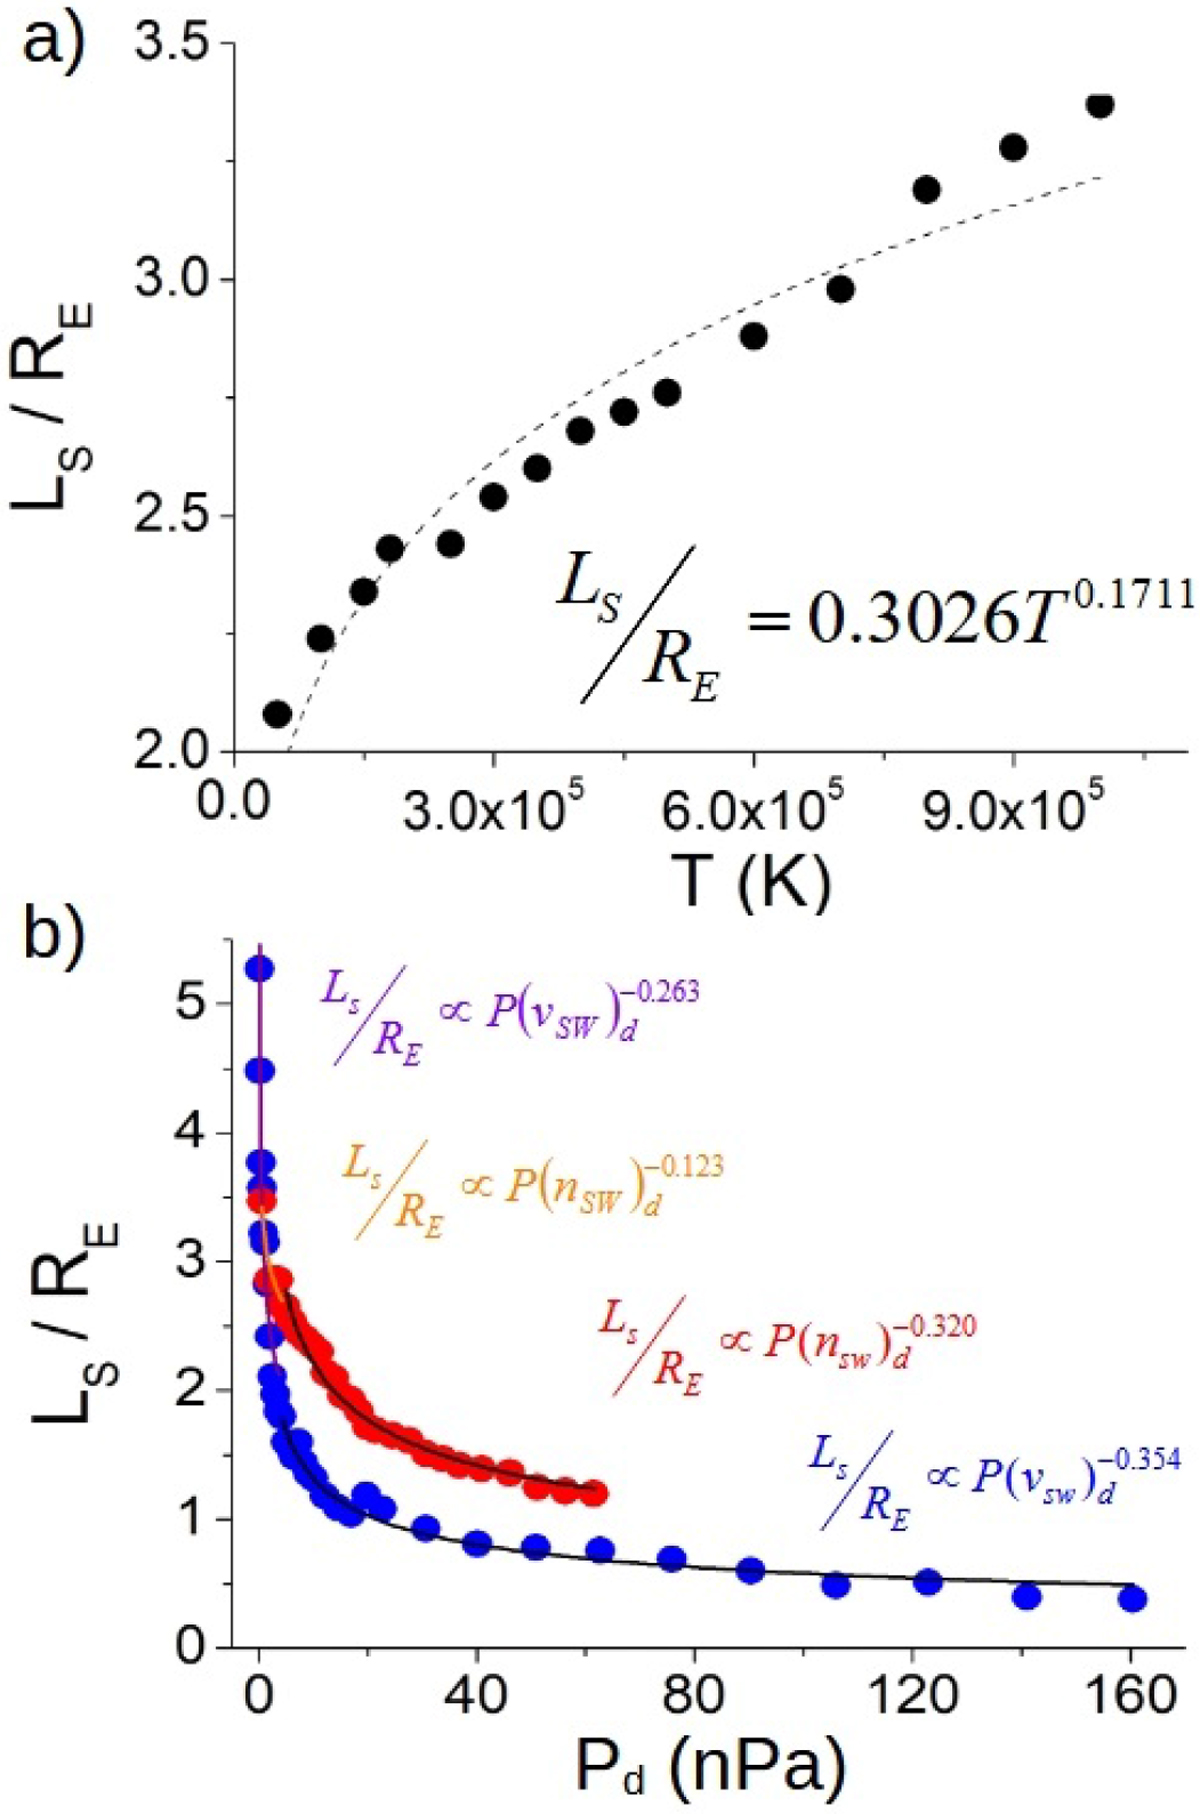
BS width for (a) different SW temperatures (fixed Pd = 1.2 nPa) and (b) different Pd values (fixed Tsw = 1.8 × 10⁵ K) when the SW density increases (fixed the SW velocity to 350 km s−1, red dots) or the SW velocities increases (fixed the SW density to 12 cm−3, blue dots). Sun–Earth IMF orientation with |B| = 10 nT. The dashed lines indicate the data fit to the expression ![]() . The solid black lines indicate the regression
. The solid black lines indicate the regression ![]() in the simulations with the SW velocity fixed and Pd > 4 nPa and
in the simulations with the SW velocity fixed and Pd > 4 nPa and ![]() in the simulations with the SW density fixed and Pd < 4 nPa. The solid violet (orange) line indicates the regression
in the simulations with the SW density fixed and Pd < 4 nPa. The solid violet (orange) line indicates the regression ![]() (
(![]() ) when Pd < 4 nPa.
) when Pd < 4 nPa.
Current usage metrics show cumulative count of Article Views (full-text article views including HTML views, PDF and ePub downloads, according to the available data) and Abstracts Views on Vision4Press platform.
Data correspond to usage on the plateform after 2015. The current usage metrics is available 48-96 hours after online publication and is updated daily on week days.
Initial download of the metrics may take a while.