Fig. 8
Download original image
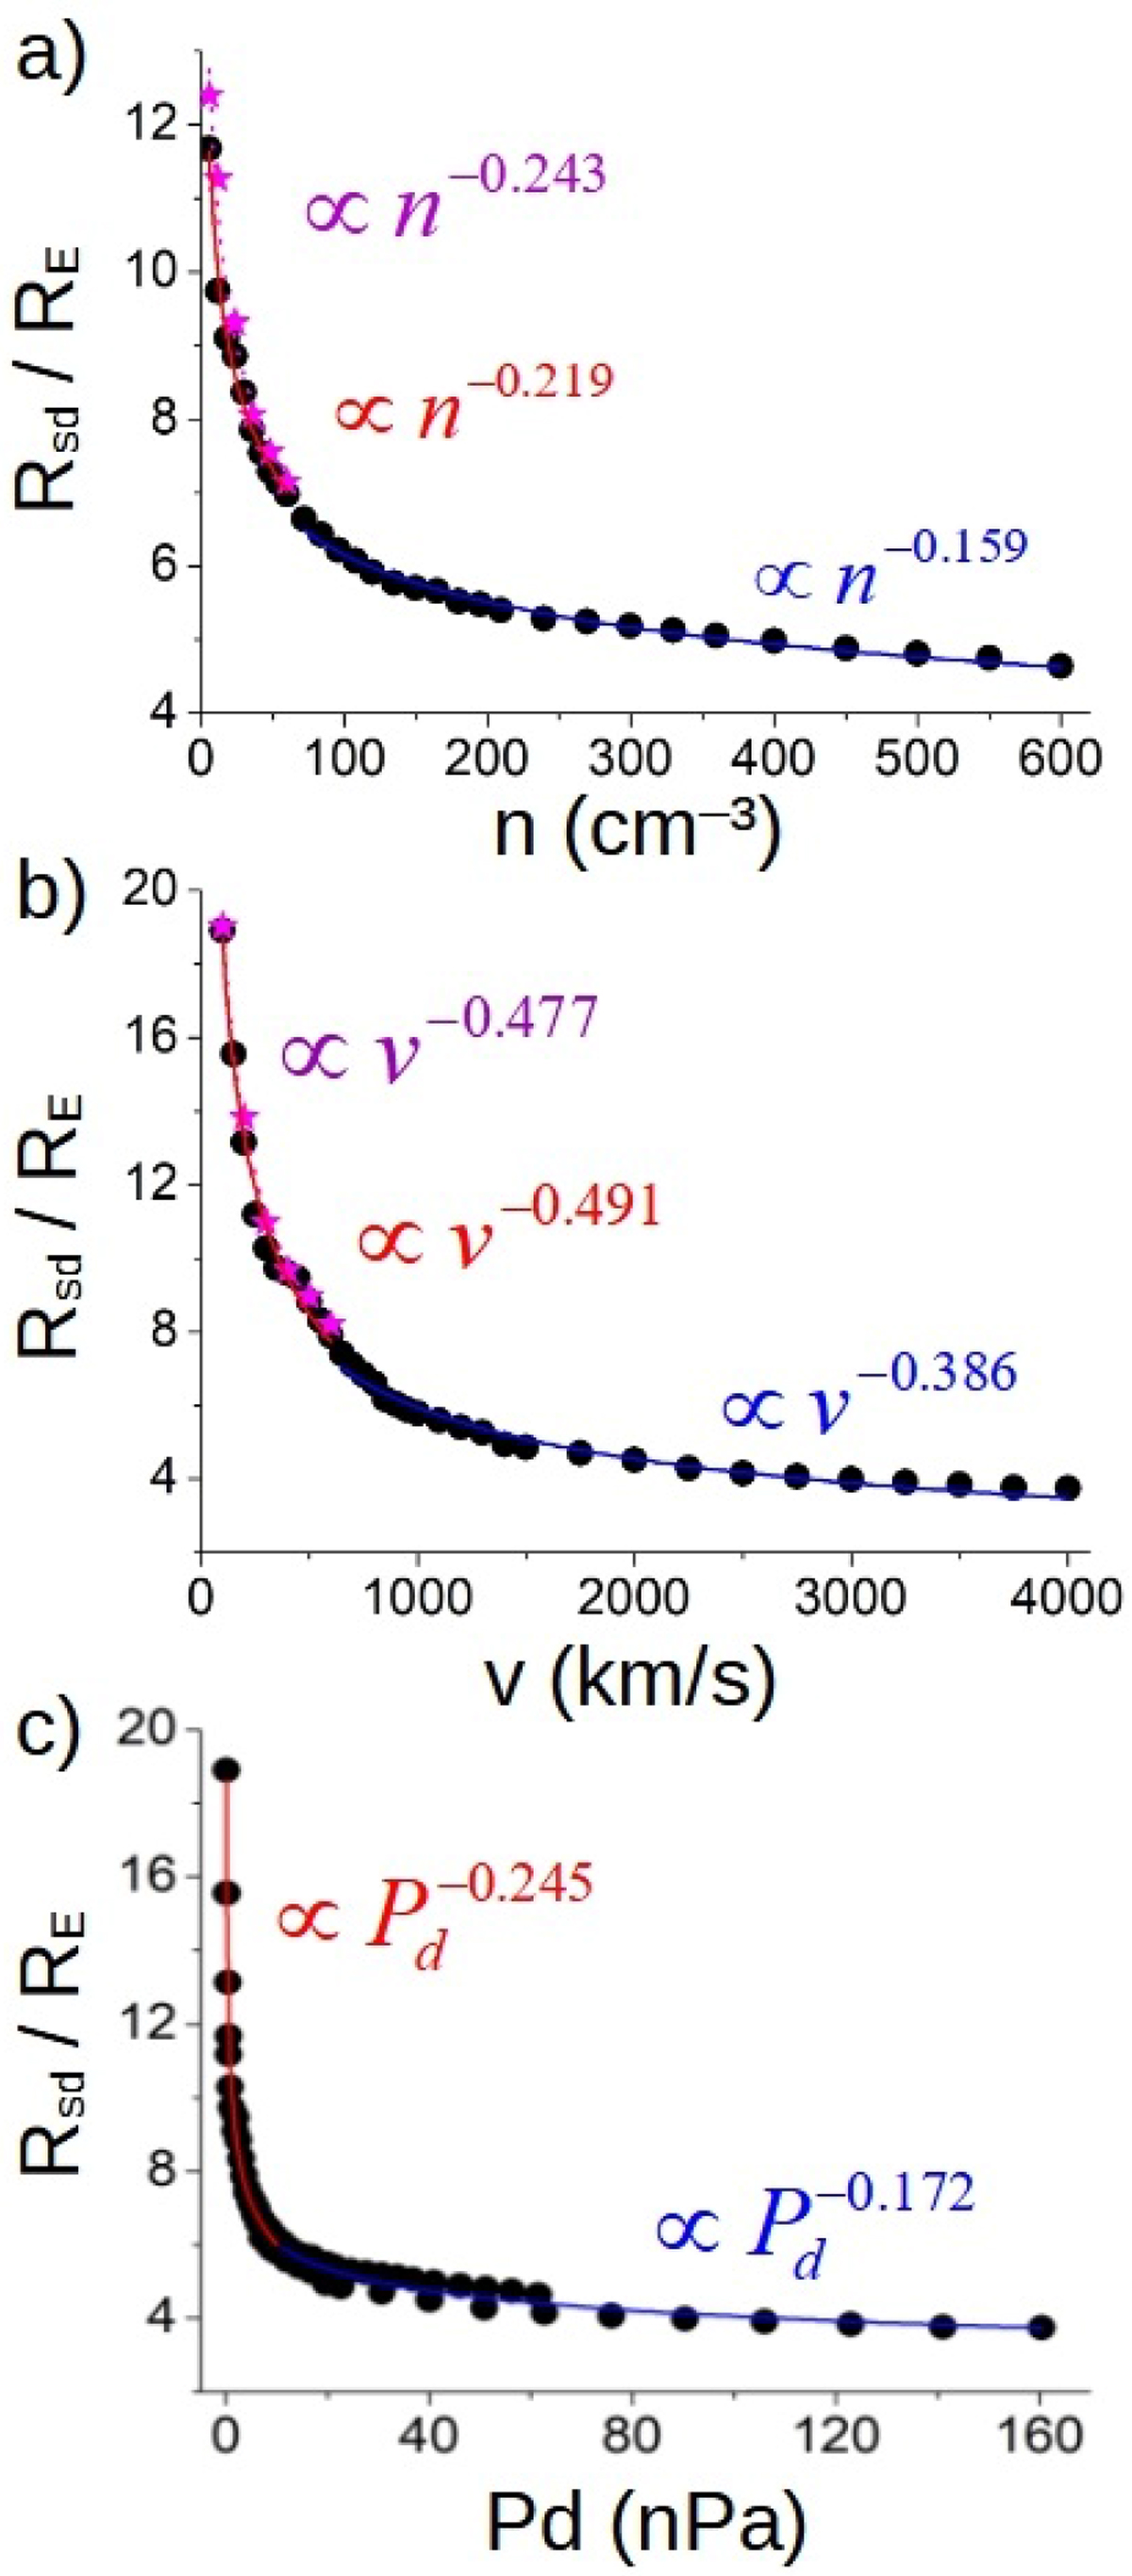
Magnetopause standoff distance with respect to (a) the SW density (fixed v = 350 km s−1), (b) SW velocities (fixed 12⋅ cm−3), and (c) dynamic pressure. Sun–Earth IMF orientation with |B| = 10 nT. The pink stars indicate the magnetopause standoff distance if |B| = 0 nT. The dashed lines indicate the data fit to the expression Rsd∕RE = Anα, Rsd ∕RE = A|v|α, and ![]() . The solid red line indicates the fit line for the data set with n ≤ 60 cm−3 and |v| ≤ 600 km s−1. The solid blue line indicates the fit line for the data set with n > 60 cm−3 and |v| > 600 km s−1. The solid pink line indicates the fit line for the data set with n ≤ 60 cm−3 and |v| ≤ 600 km s−1 and no IMF.
. The solid red line indicates the fit line for the data set with n ≤ 60 cm−3 and |v| ≤ 600 km s−1. The solid blue line indicates the fit line for the data set with n > 60 cm−3 and |v| > 600 km s−1. The solid pink line indicates the fit line for the data set with n ≤ 60 cm−3 and |v| ≤ 600 km s−1 and no IMF.
Current usage metrics show cumulative count of Article Views (full-text article views including HTML views, PDF and ePub downloads, according to the available data) and Abstracts Views on Vision4Press platform.
Data correspond to usage on the plateform after 2015. The current usage metrics is available 48-96 hours after online publication and is updated daily on week days.
Initial download of the metrics may take a while.