Fig. 4
Download original image
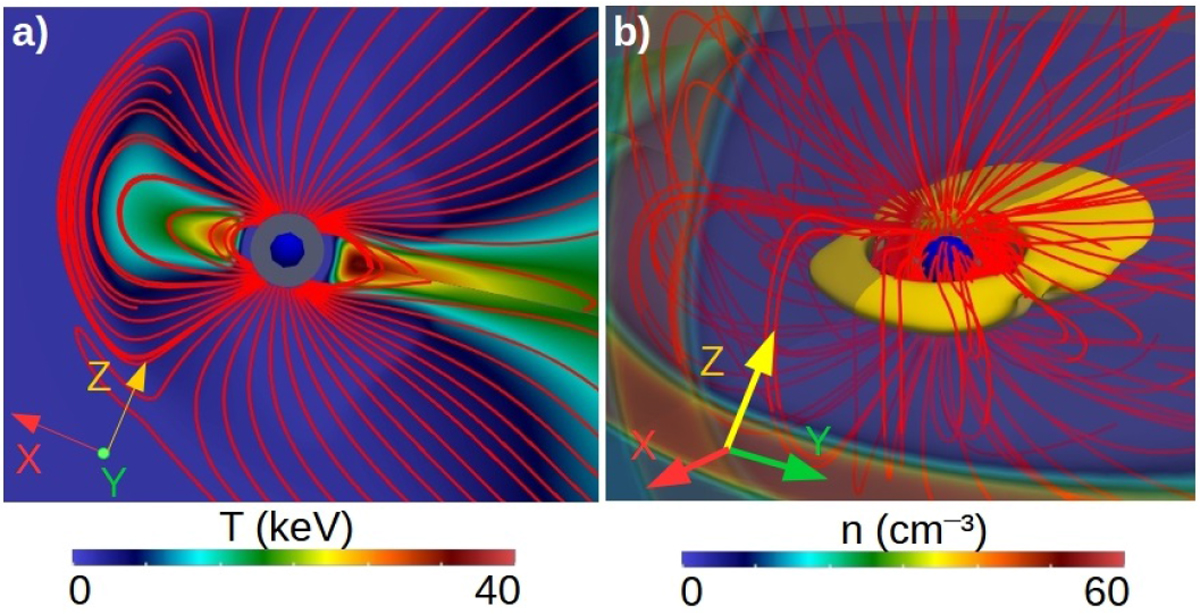
(a) Polar cut (XY plane) of the plasma temperature and (b) 3D view of the Earth magnetosphere adding the plasma temperature isocountour T = 26 keV (orange surface, temperature local maxima at R = 3 RE planet DS) and a polar/equatorial (XY∕XZ plane) cut of the plasma density for a simulation without an IMF and Pd = 1.2 nPa. The red lines indicate the Earth magnetic field lines.
Current usage metrics show cumulative count of Article Views (full-text article views including HTML views, PDF and ePub downloads, according to the available data) and Abstracts Views on Vision4Press platform.
Data correspond to usage on the plateform after 2015. The current usage metrics is available 48-96 hours after online publication and is updated daily on week days.
Initial download of the metrics may take a while.