Fig. B.1
Download original image
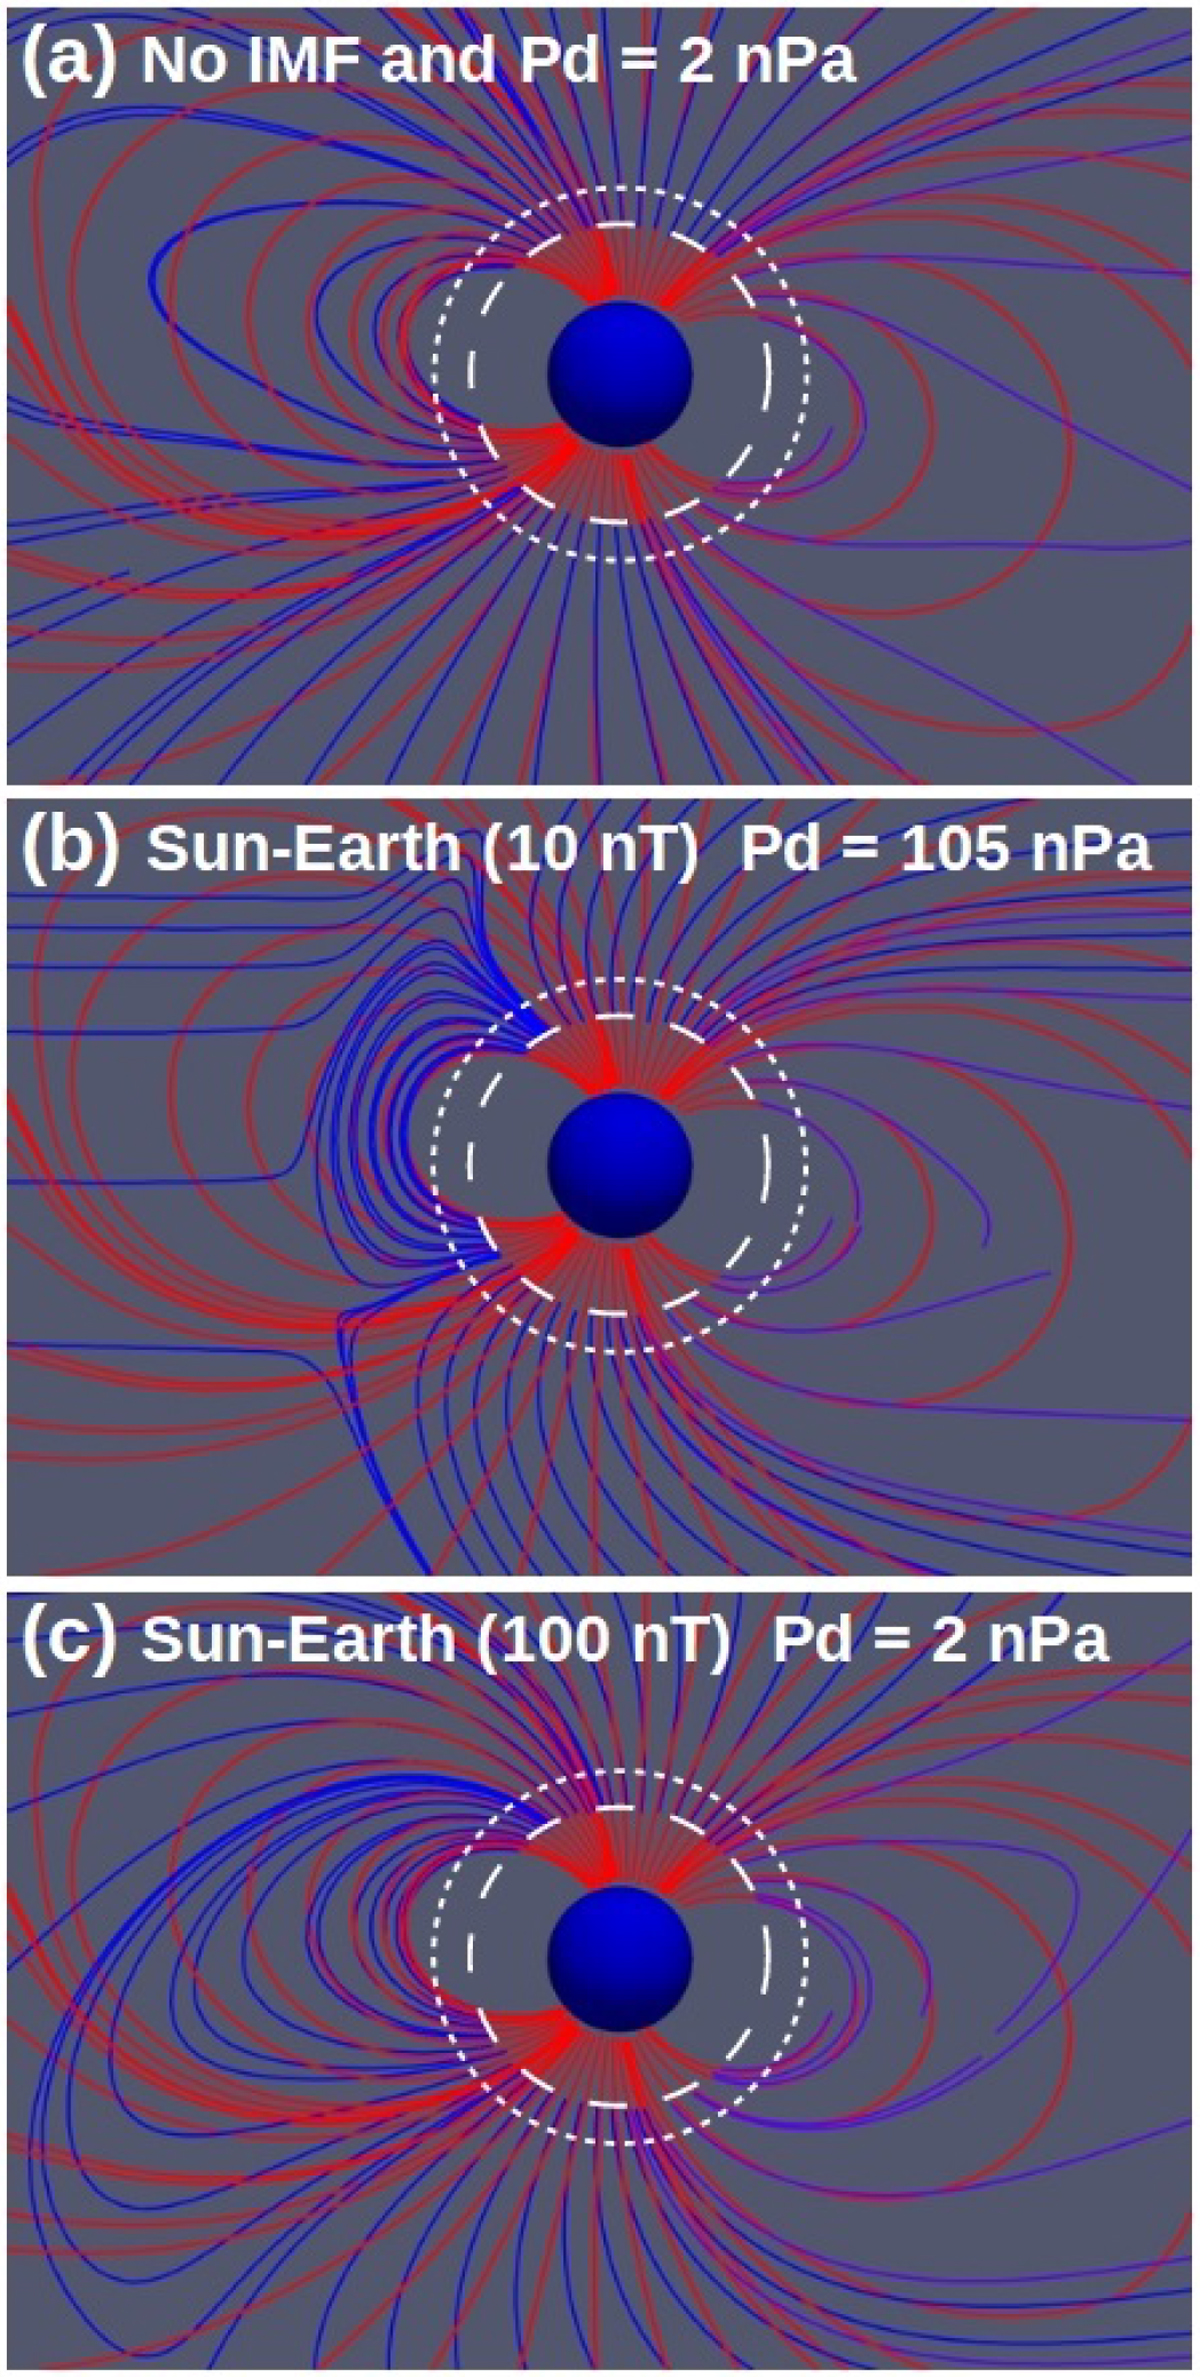
3D view of the magnetic field line mapping between an unperturbed dipole and simulations with (a) no IMF and Pd = 2 nPa, (b) Sun-Earth IMF |B|IMF = 10 nT and Pd = 105 nPa, and (c) Sun-Earth IMF |B|IMF = 100 nT and Pd = 2 nPa. The dashed white line indicates the inner boundary of the simulation domain (R∕RE = 2), and the dotted white line shows the upper boundary of the ionosphere model (R∕RE = 2.5). The red lines show the magnetic field lines in the simulation with only the dipole magnetic field and the blue lines the magnetic field lines in the simulation with dipole + IMF magnetic fields.
Current usage metrics show cumulative count of Article Views (full-text article views including HTML views, PDF and ePub downloads, according to the available data) and Abstracts Views on Vision4Press platform.
Data correspond to usage on the plateform after 2015. The current usage metrics is available 48-96 hours after online publication and is updated daily on week days.
Initial download of the metrics may take a while.