Fig. 23
Download original image
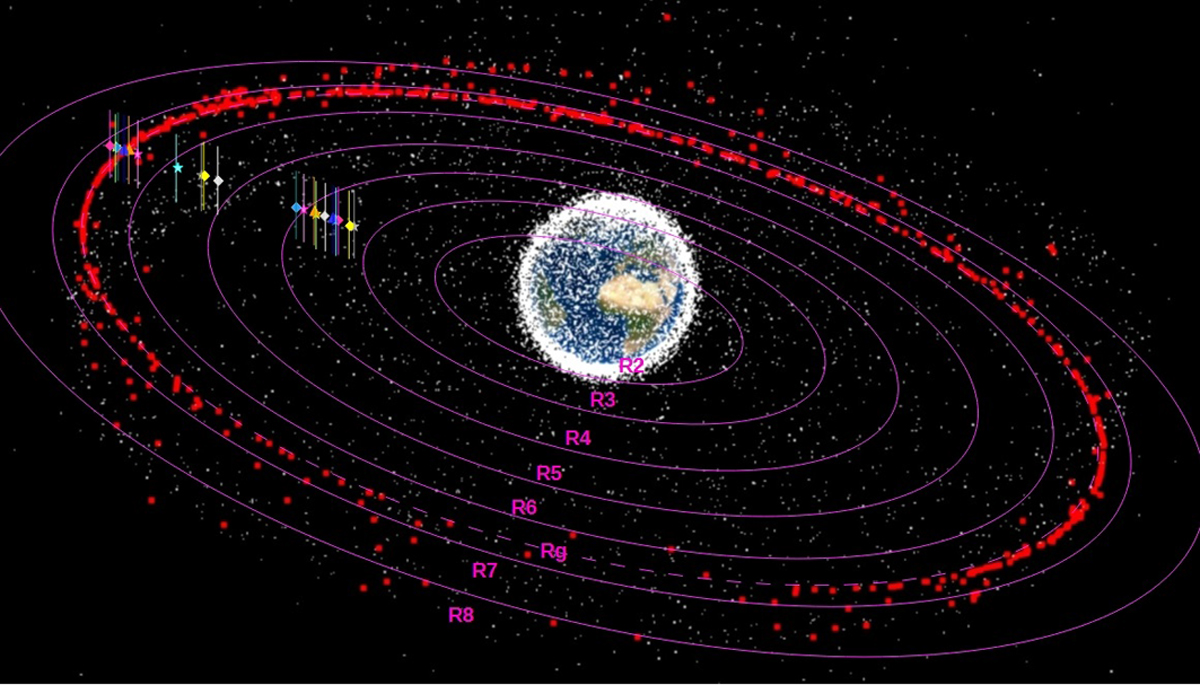
Schematic view of the satellites at geosynchronous, high, medium, and low orbits around the Earth between 2000–2020. The orbits highlighted by red dots are geosynchronous satellites. The solid pink lines indicate orbits at R∕RE = i with i an integer between 2 to 8 (Ri). The dashed pink line indicates the geosynchronous orbit (Rg). The colored symbols and horizontal lines show the standoff distance of the magnetopause and the BS nose for the different ICMEs we analyzed: light green star for 22∕10∕1999, light cyan star for 16∕07∕2000, light pink star for 31∕03∕2001b, light gray star for 24∕11∕2001, yellow diamond for 29∕05∕2003, cyan diamond for 24∕10∕2003, pink diamond for 07∕11∕2004, gray diamond for 21∕01∕2005, orange triangle for 15∕05∕2005, and blue triangle for 24∕08∕2005.
Current usage metrics show cumulative count of Article Views (full-text article views including HTML views, PDF and ePub downloads, according to the available data) and Abstracts Views on Vision4Press platform.
Data correspond to usage on the plateform after 2015. The current usage metrics is available 48-96 hours after online publication and is updated daily on week days.
Initial download of the metrics may take a while.