Fig. 1
Download original image
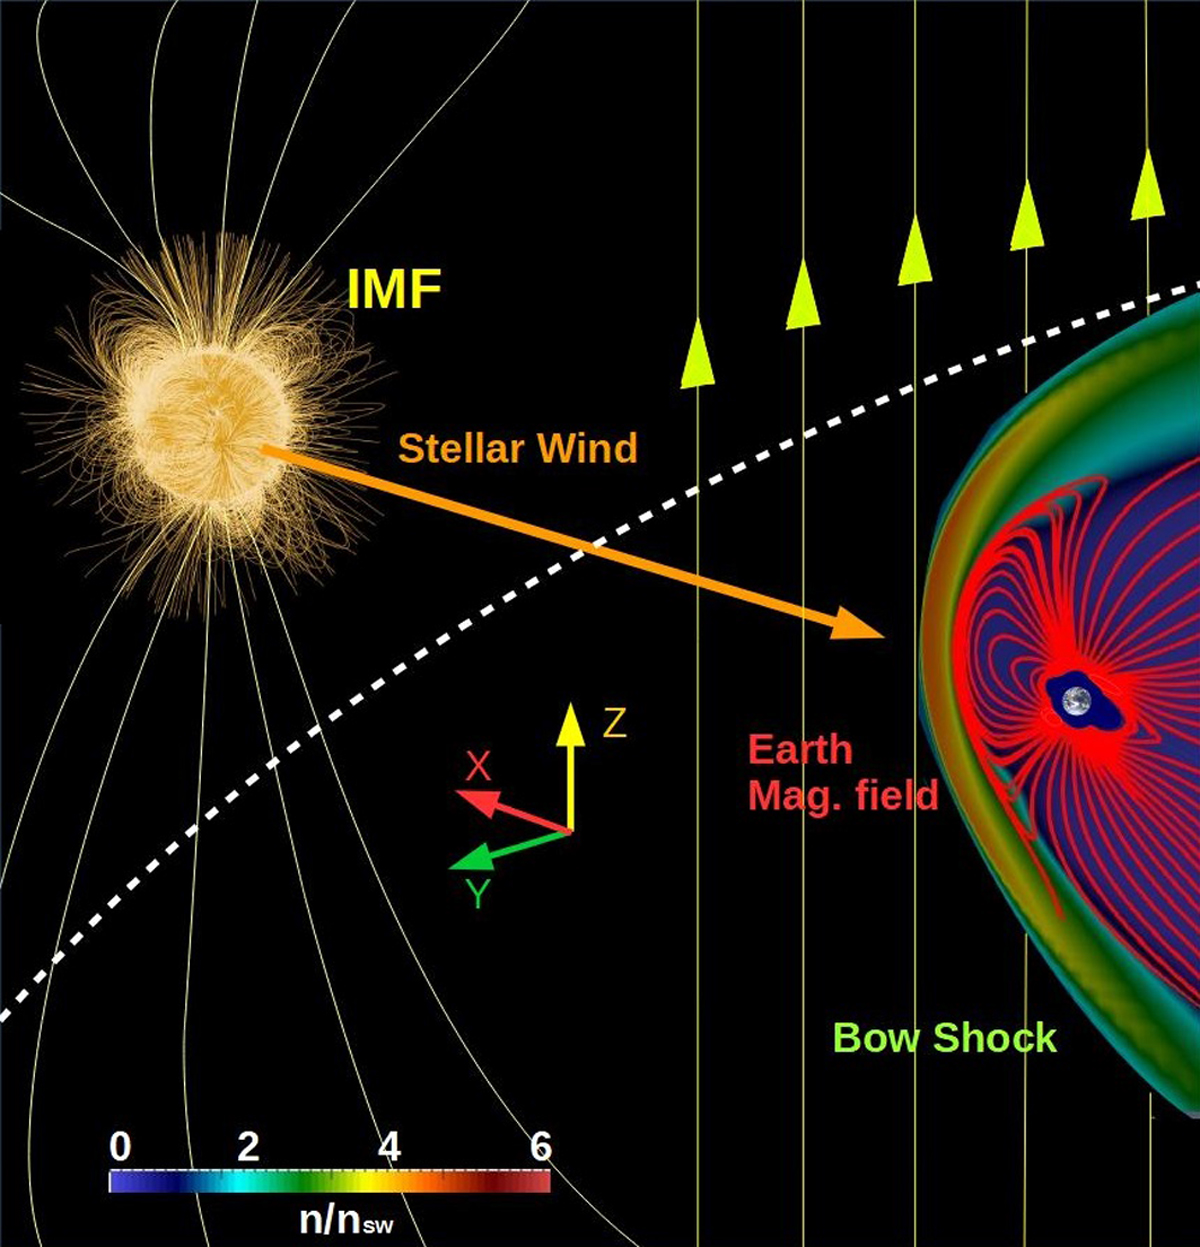
3D view of a typical simulation setup. We show the density distribution (color scale), Earth magnetic field lines (red lines), and IMF (yellow lines). The yellow arrows indicate the orientation of the IMF (northward orientation). The dashed white line shows the beginning of the simulation domain (the star is not included in the model).
Current usage metrics show cumulative count of Article Views (full-text article views including HTML views, PDF and ePub downloads, according to the available data) and Abstracts Views on Vision4Press platform.
Data correspond to usage on the plateform after 2015. The current usage metrics is available 48-96 hours after online publication and is updated daily on week days.
Initial download of the metrics may take a while.