Fig. 7.
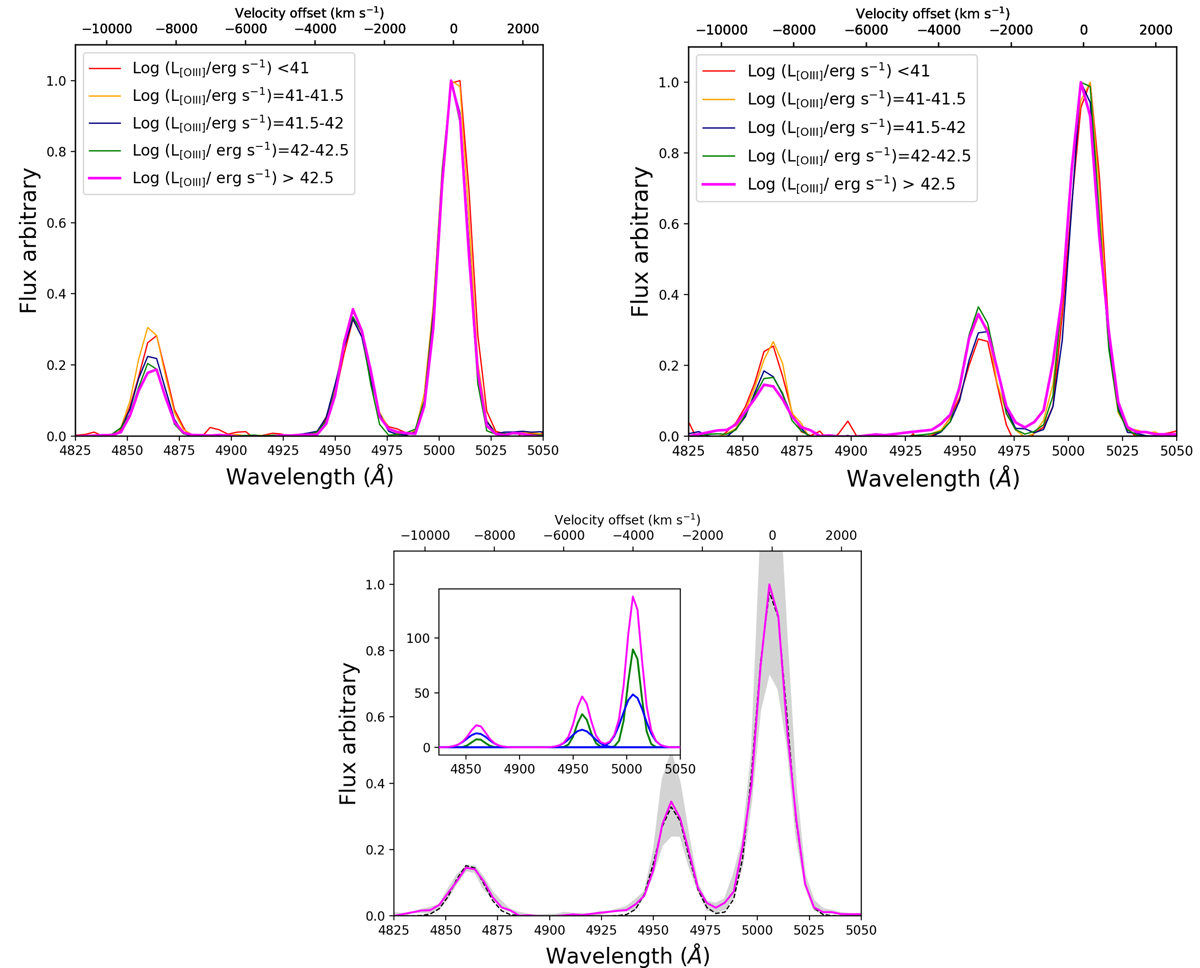
Download original image
Comparison of the stacked spectra, in the Hβ–[OIII] doublet lines wavelength range, in bins of [OIII]λ5007 luminosity above (left) and below (right) the line threshold, as defined in Sect. 4.2 (lower panel). Stacked spectrum in the [OIII] luminosity bin Log (L[OIII]/erg s−1) > 42.5 of the low-SF Type II AGN with superimposed the 1σ uncertainties estimated through a bootstrap resampling technique and the best-fitting one-component Gaussian curve (black dashed line). The inset shows the best-fit double-Gaussian model (magenta curve) and its line decomposition (green and blue Gaussian profiles refer to the narrow and broad best-fit components).
Current usage metrics show cumulative count of Article Views (full-text article views including HTML views, PDF and ePub downloads, according to the available data) and Abstracts Views on Vision4Press platform.
Data correspond to usage on the plateform after 2015. The current usage metrics is available 48-96 hours after online publication and is updated daily on week days.
Initial download of the metrics may take a while.