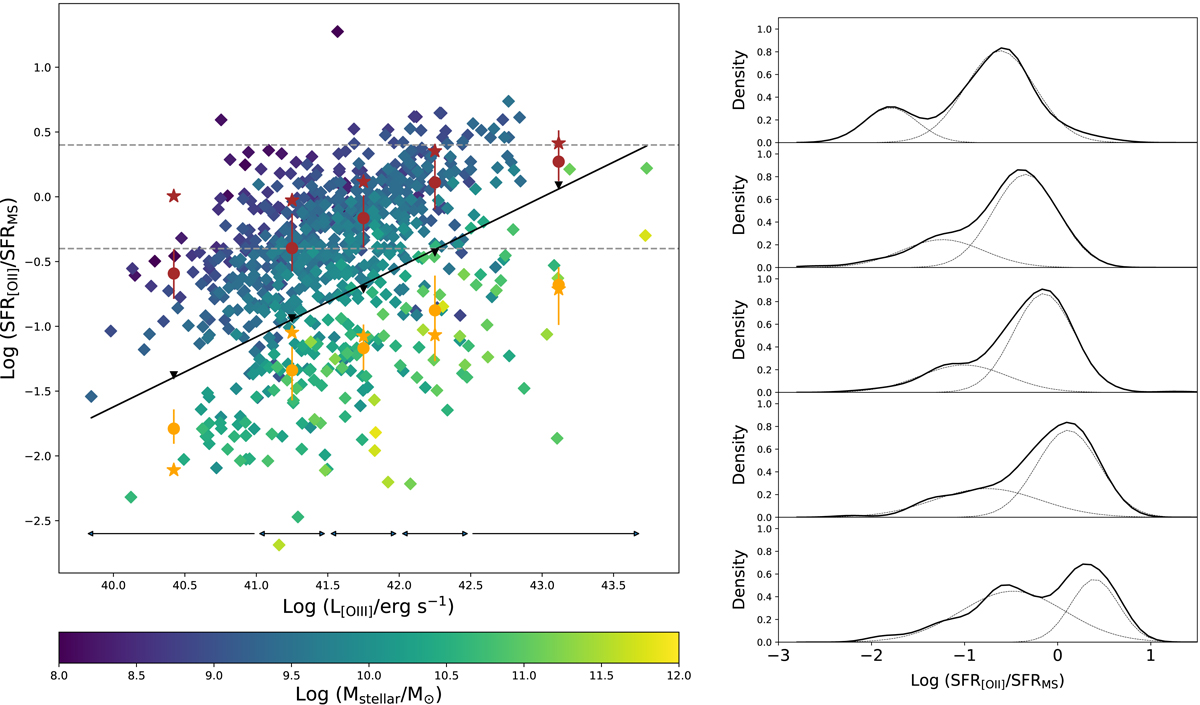
Fig. 6.
Download original image
SFR offset from the MS (parametrized as SFR[OII]/SFRMS) and its probability density function in bins of [OIII] luminosity for the VIMOS sample. Left panel: SFR offset is shown as a function of [OIII] luminosity (proxy of AGN power) with full diamonds, colour-coded according to the stellar mass. Circles and stars represent median values of the SFR offset derived using [OII]-based and SED-based SFRs, respectively, for the subset of sources above the black diagonal line (brown) and for those below (orange) in five bins of [OIII] luminosity (see main text for details). The five bins of [OIII] luminosity are given by the black horizontal segments. The horizontal dashed lines delimit the locus of the MS ± 0.4 dex. Right panel: probability density function of the SFR offset (black solid curves) in the five [OIII] luminosity bins in the left panel, with superimposed the best-fit double Gaussian components (black dashed curves) which reproduce the observed bimodality. The intersection points of the two Gaussians in the five luminosity bins are represented as upside down triangles in the left panel (see Sect. 4.2).
Current usage metrics show cumulative count of Article Views (full-text article views including HTML views, PDF and ePub downloads, according to the available data) and Abstracts Views on Vision4Press platform.
Data correspond to usage on the plateform after 2015. The current usage metrics is available 48-96 hours after online publication and is updated daily on week days.
Initial download of the metrics may take a while.