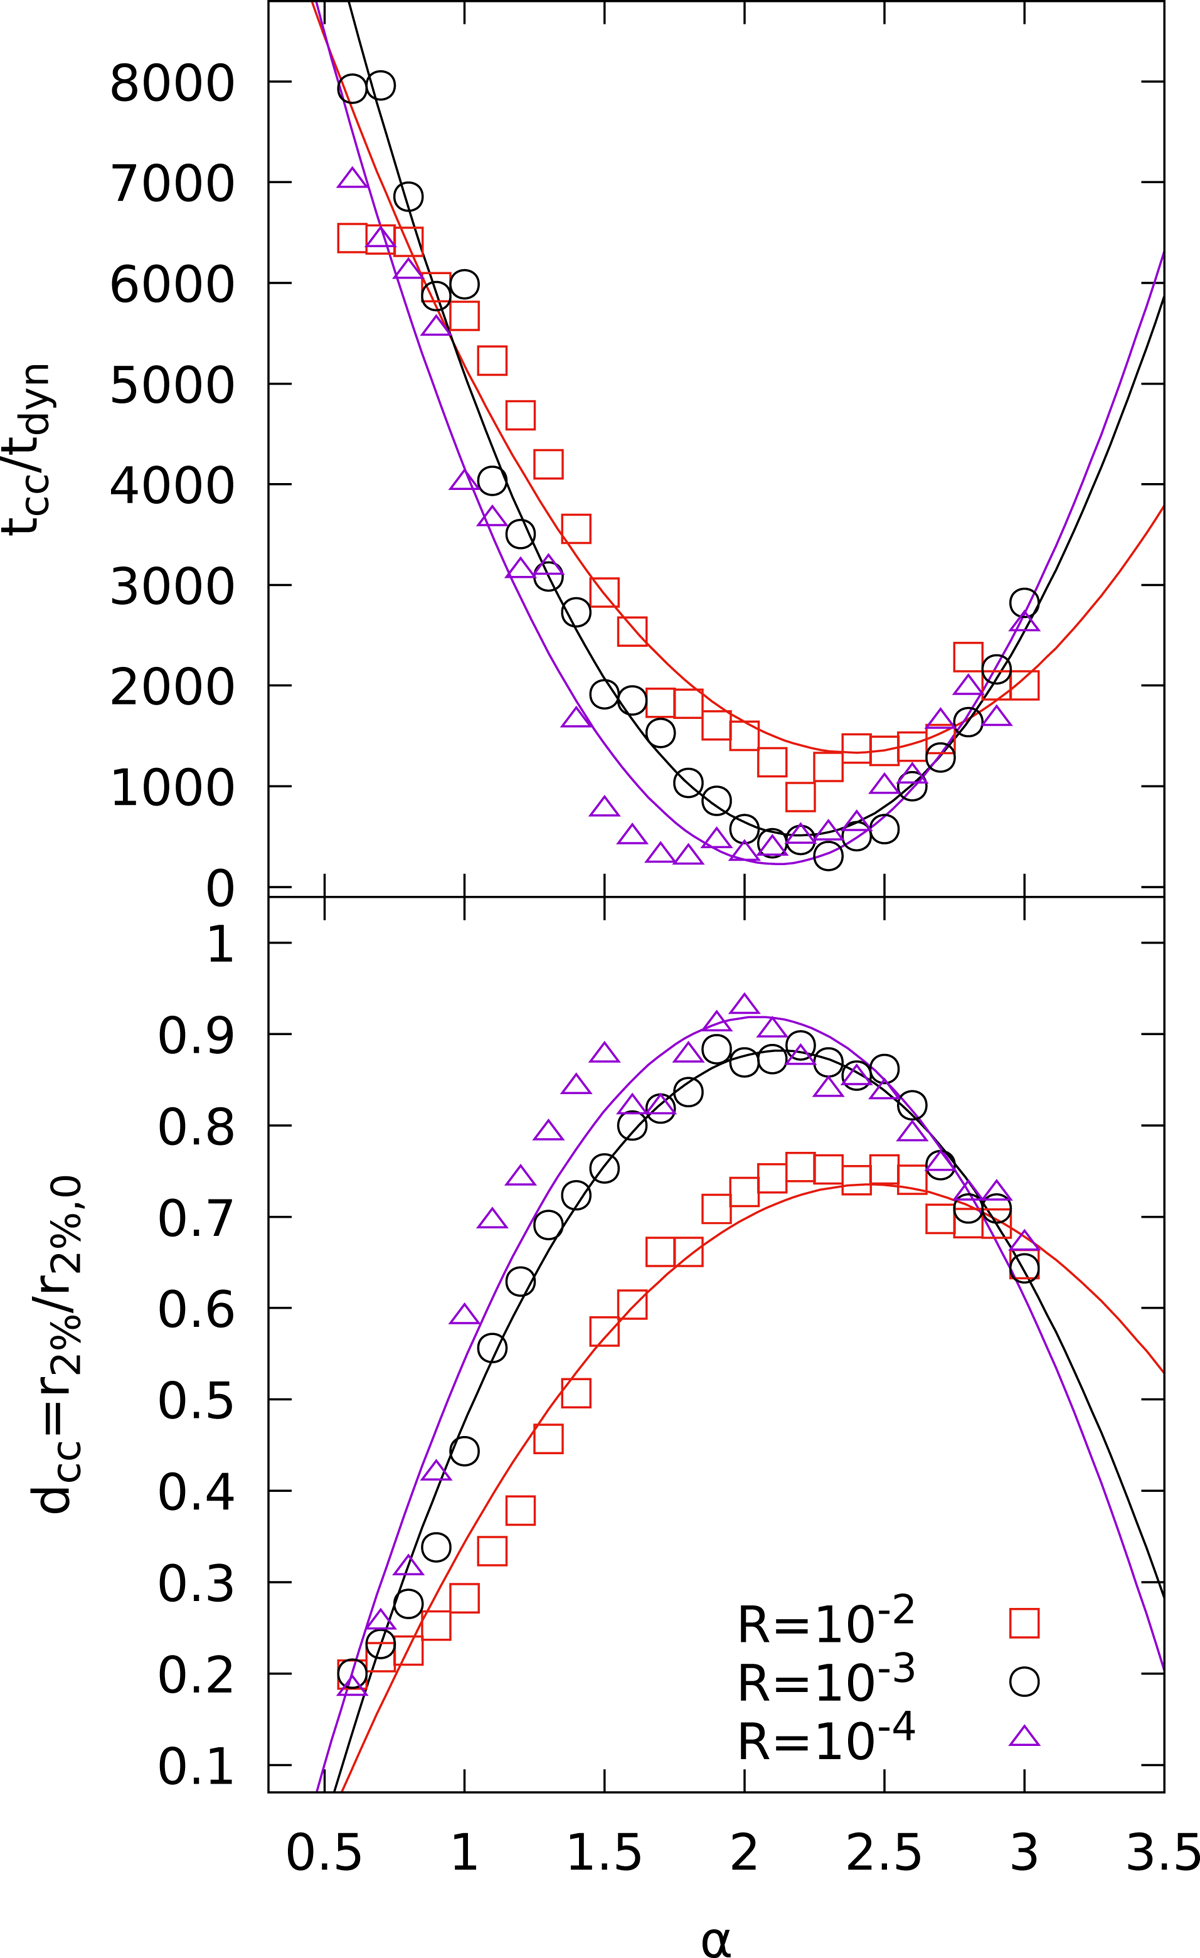
Fig. 7.
Download original image
Time of core collapse as a function of the mass-function slope (top panel) and depth of core collapse (bottom panel) for isolated Plummer models with N = 2 × 10⁵ and ℛ = 10−2 (red squares), 10−3 (black circles), and 10−4 (purple triangles). The times are given in units of the dynamical time, tdyn. The solid lines mark our second-order polynomial best fit.
Current usage metrics show cumulative count of Article Views (full-text article views including HTML views, PDF and ePub downloads, according to the available data) and Abstracts Views on Vision4Press platform.
Data correspond to usage on the plateform after 2015. The current usage metrics is available 48-96 hours after online publication and is updated daily on week days.
Initial download of the metrics may take a while.