Free Access
Fig. 3.
Download original image
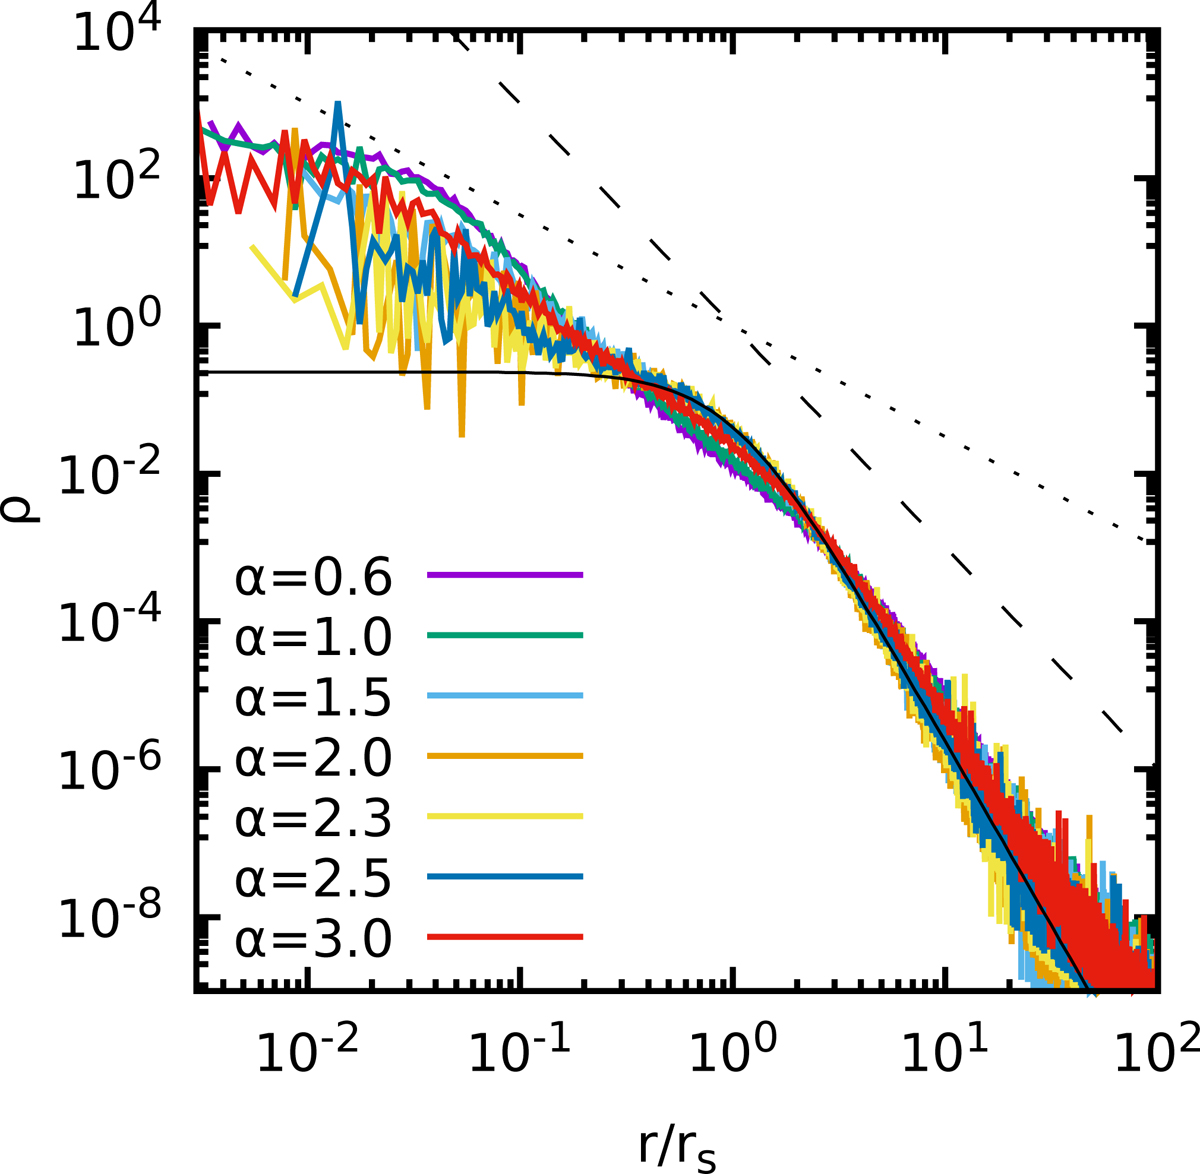
Double power-law 3D density profile at tcc for models with α = 0.6, 1.0, 1.5, 2.0, 2.3, 2.5, and 3.0, N = 2 × 10⁵, and ℛ = 10−3. The initial isotropic Plummer profile is shown as a solid thin black line. The dashed and dotted lines mark the inner and outer limit trends (ρ ∼ r−1.5 and ∼r−3 of the core density, respectively).
Current usage metrics show cumulative count of Article Views (full-text article views including HTML views, PDF and ePub downloads, according to the available data) and Abstracts Views on Vision4Press platform.
Data correspond to usage on the plateform after 2015. The current usage metrics is available 48-96 hours after online publication and is updated daily on week days.
Initial download of the metrics may take a while.