Fig. 6.
Download original image
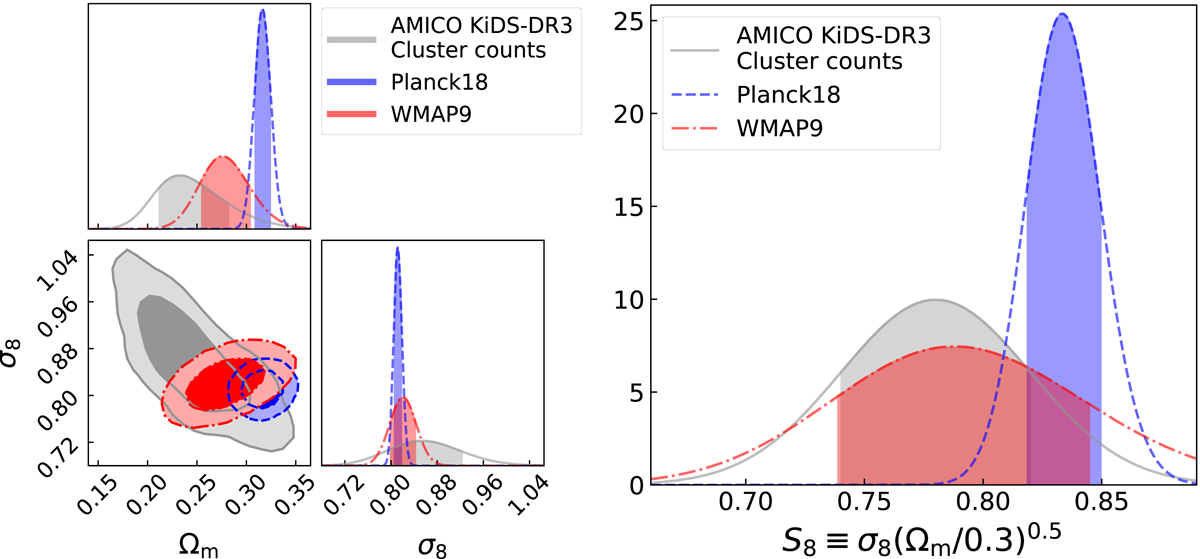
Comparison with WMAP and Planck results. Left panel: we show the Ωm − σ8 parameter space, along with the 1D marginalised posteriors with the relative intervals between the 16th and 84th percentiles, in the case of the cluster counts’ analysis in the AMICO KiDS-DR3 catalogue (solid grey lines). In the same panel, we also display the results from WMAP (Hinshaw et al. 2013) (Table 3, WMAP-only Nine-year; red dash-dotted lines) and Planck (Planck Collaboration VI 2020) (Table 2, TT, TE, and EE+lowE; blue dashed lines). Right panel: we show the posteriors for the parameter S8, where the bands show the intervals between 16th and 84th percentiles. The symbols are the same as in the left panel.
Current usage metrics show cumulative count of Article Views (full-text article views including HTML views, PDF and ePub downloads, according to the available data) and Abstracts Views on Vision4Press platform.
Data correspond to usage on the plateform after 2015. The current usage metrics is available 48-96 hours after online publication and is updated daily on week days.
Initial download of the metrics may take a while.