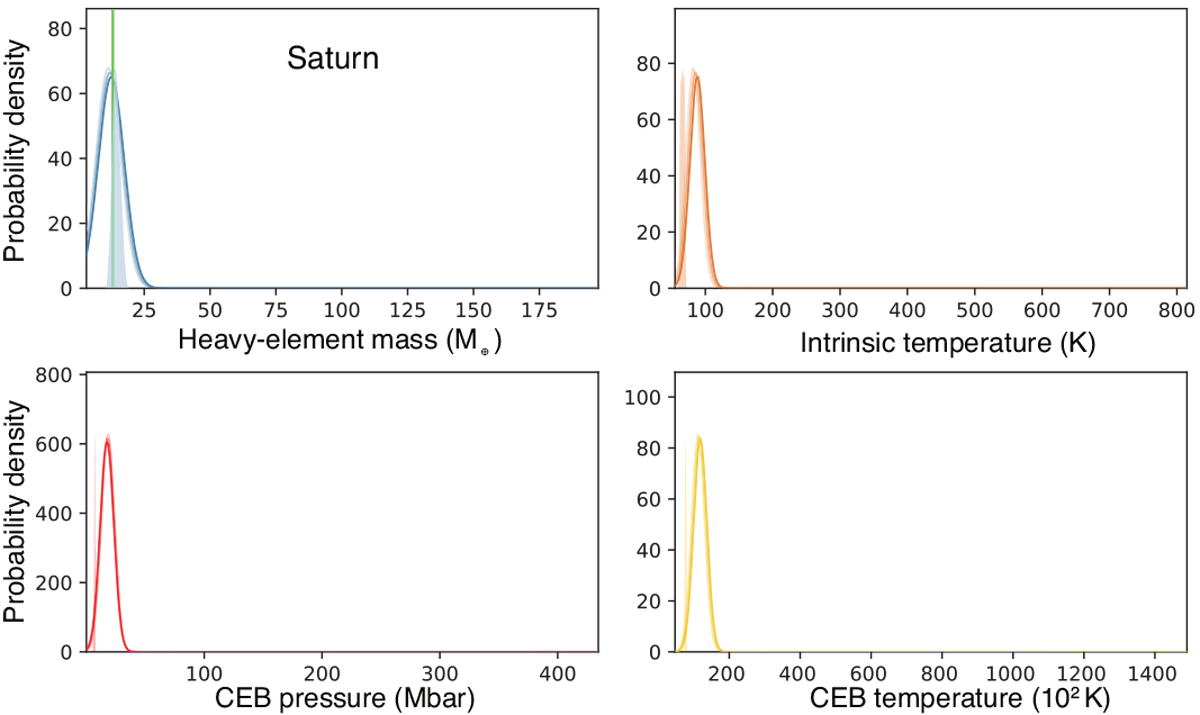
Fig. 7
Download original image
Same as in Fig. 6, but for Saturn. For the MDN predictions denoted by colored lines, different shades of color correspond to different surface temperatures (T1 = 130, 135, 140 K from light to dark). Saturn’s total heavy-element mass, determined from the detailed interior models using the CMS19 H–He EOS as well (Nettelmann et al. 2021), is shown by green vertical bands.
Current usage metrics show cumulative count of Article Views (full-text article views including HTML views, PDF and ePub downloads, according to the available data) and Abstracts Views on Vision4Press platform.
Data correspond to usage on the plateform after 2015. The current usage metrics is available 48-96 hours after online publication and is updated daily on week days.
Initial download of the metrics may take a while.