Fig. 5
Download original image
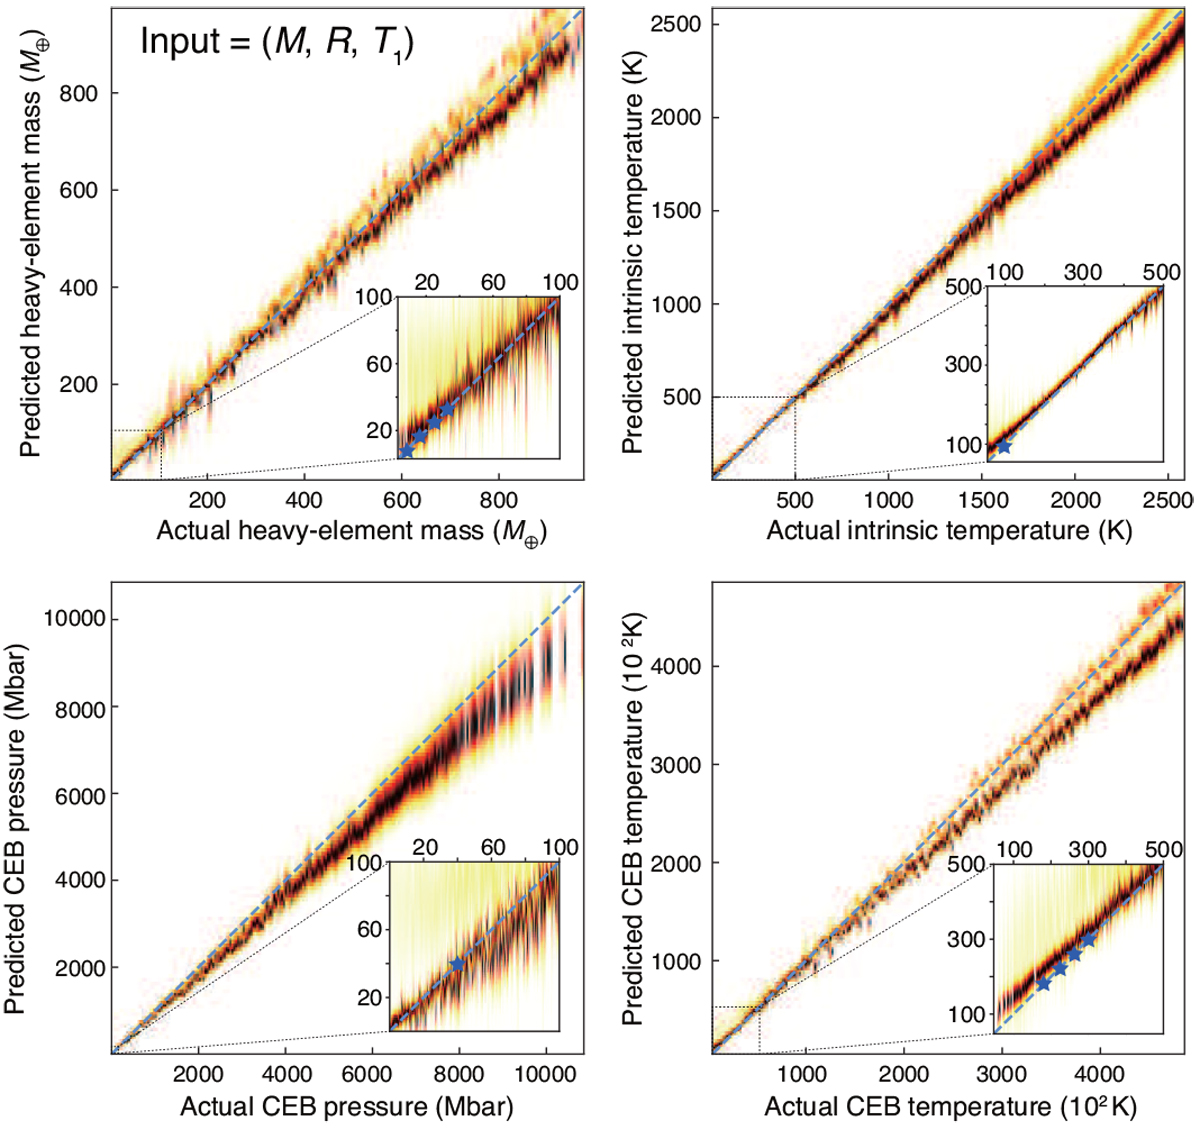
Same as in Fig. 4, but for the predicted distributions of four output variables from the MDN trained on (M, R, T1) inputs. In view of the wide ranges of these four variables, a small chart is inserted for each output variable to illustrate the low-value behavior. Jupiter’s interior properties are marked by navy blue stars in the four inserted charts.
Current usage metrics show cumulative count of Article Views (full-text article views including HTML views, PDF and ePub downloads, according to the available data) and Abstracts Views on Vision4Press platform.
Data correspond to usage on the plateform after 2015. The current usage metrics is available 48-96 hours after online publication and is updated daily on week days.
Initial download of the metrics may take a while.