Fig. A.1.
Download original image
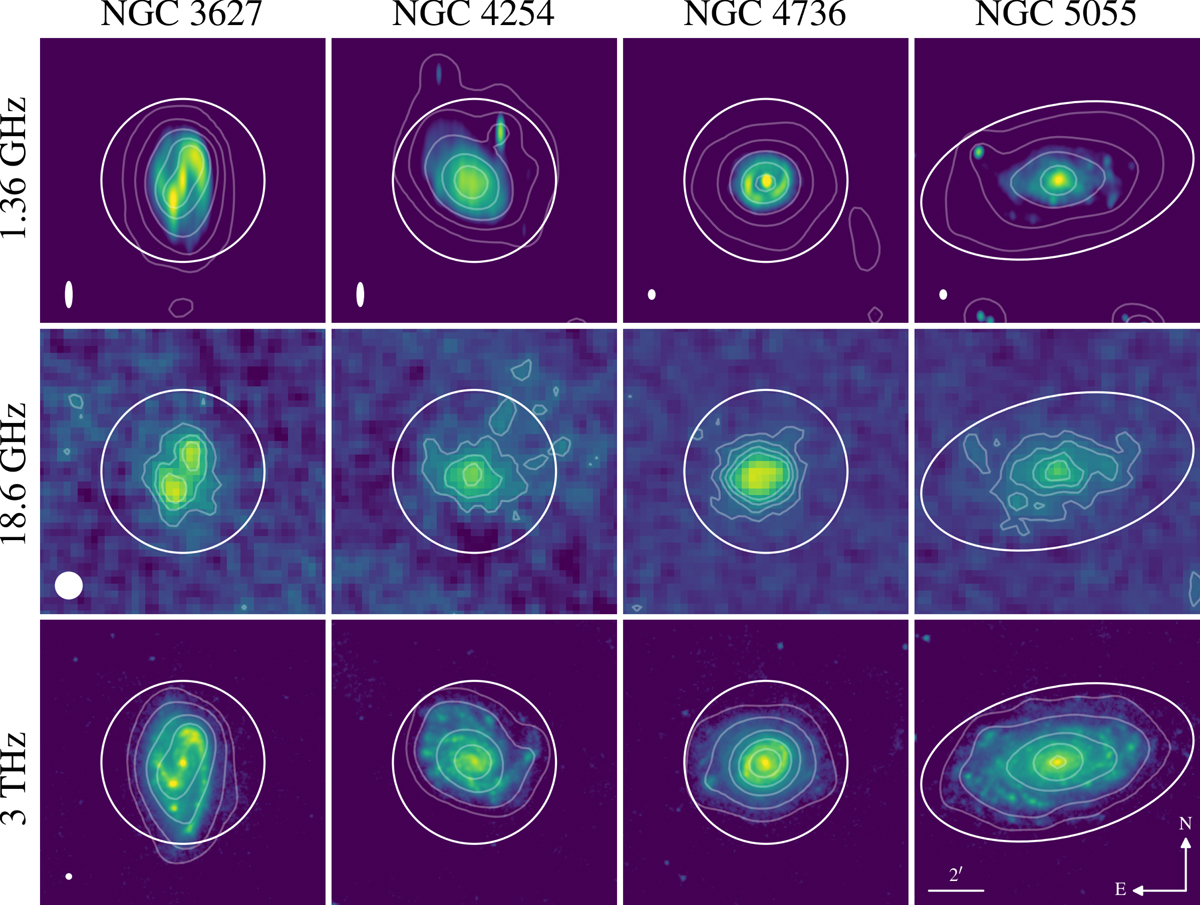
Maps at different frequencies. Top panels: Westerbork Synthesis Radio Telescope 1.36 GHz images from Braun et al. (2007); the white ellipses show the synthesized beams; the contours show the same maps smoothed to the SRT 18.6 GHz resolution (HPBW = 57″) at surface brightness levels of 0.025, 0.1, 0.25, 0.5, and 0.75 MJy sr−1. Bottom panels: Herschel 3 THz (100 μm) maps from DustPedia, with HPBW = 10″ (white circle); the contours show the maps smoothed to the SRT resolution, at 5, 20, 100, 250, and 500 MJy sr−1. As a reference, the SRT images at 18.6 GHz are shown in the central panel (as in Fig. 1). The apertures adopted in our work are also shown.
Current usage metrics show cumulative count of Article Views (full-text article views including HTML views, PDF and ePub downloads, according to the available data) and Abstracts Views on Vision4Press platform.
Data correspond to usage on the plateform after 2015. The current usage metrics is available 48-96 hours after online publication and is updated daily on week days.
Initial download of the metrics may take a while.