Fig. 4.
Download original image
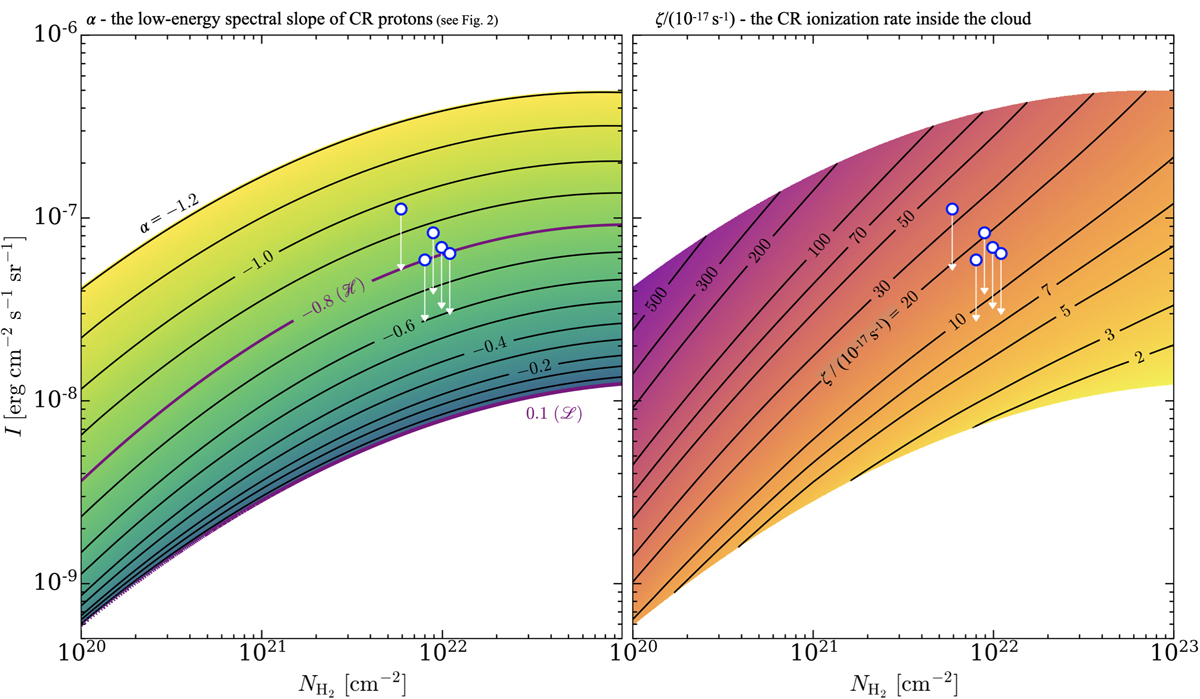
(1 − 0)S(0) line brightness as a function of the cloud H2 column density for different models of the interstellar CR proton spectrum impinging upon the cloud (see Fig. 3). Contours: CR spectral slope α (left) and the (attenuated) CR ionization rate inside the cloud (right). The five markers are our 3σ upper limits on the (1 − 0)S(0) line, which translate into upper limits on ζ and lower limits on α.
Current usage metrics show cumulative count of Article Views (full-text article views including HTML views, PDF and ePub downloads, according to the available data) and Abstracts Views on Vision4Press platform.
Data correspond to usage on the plateform after 2015. The current usage metrics is available 48-96 hours after online publication and is updated daily on week days.
Initial download of the metrics may take a while.