Fig. 2.
Download original image
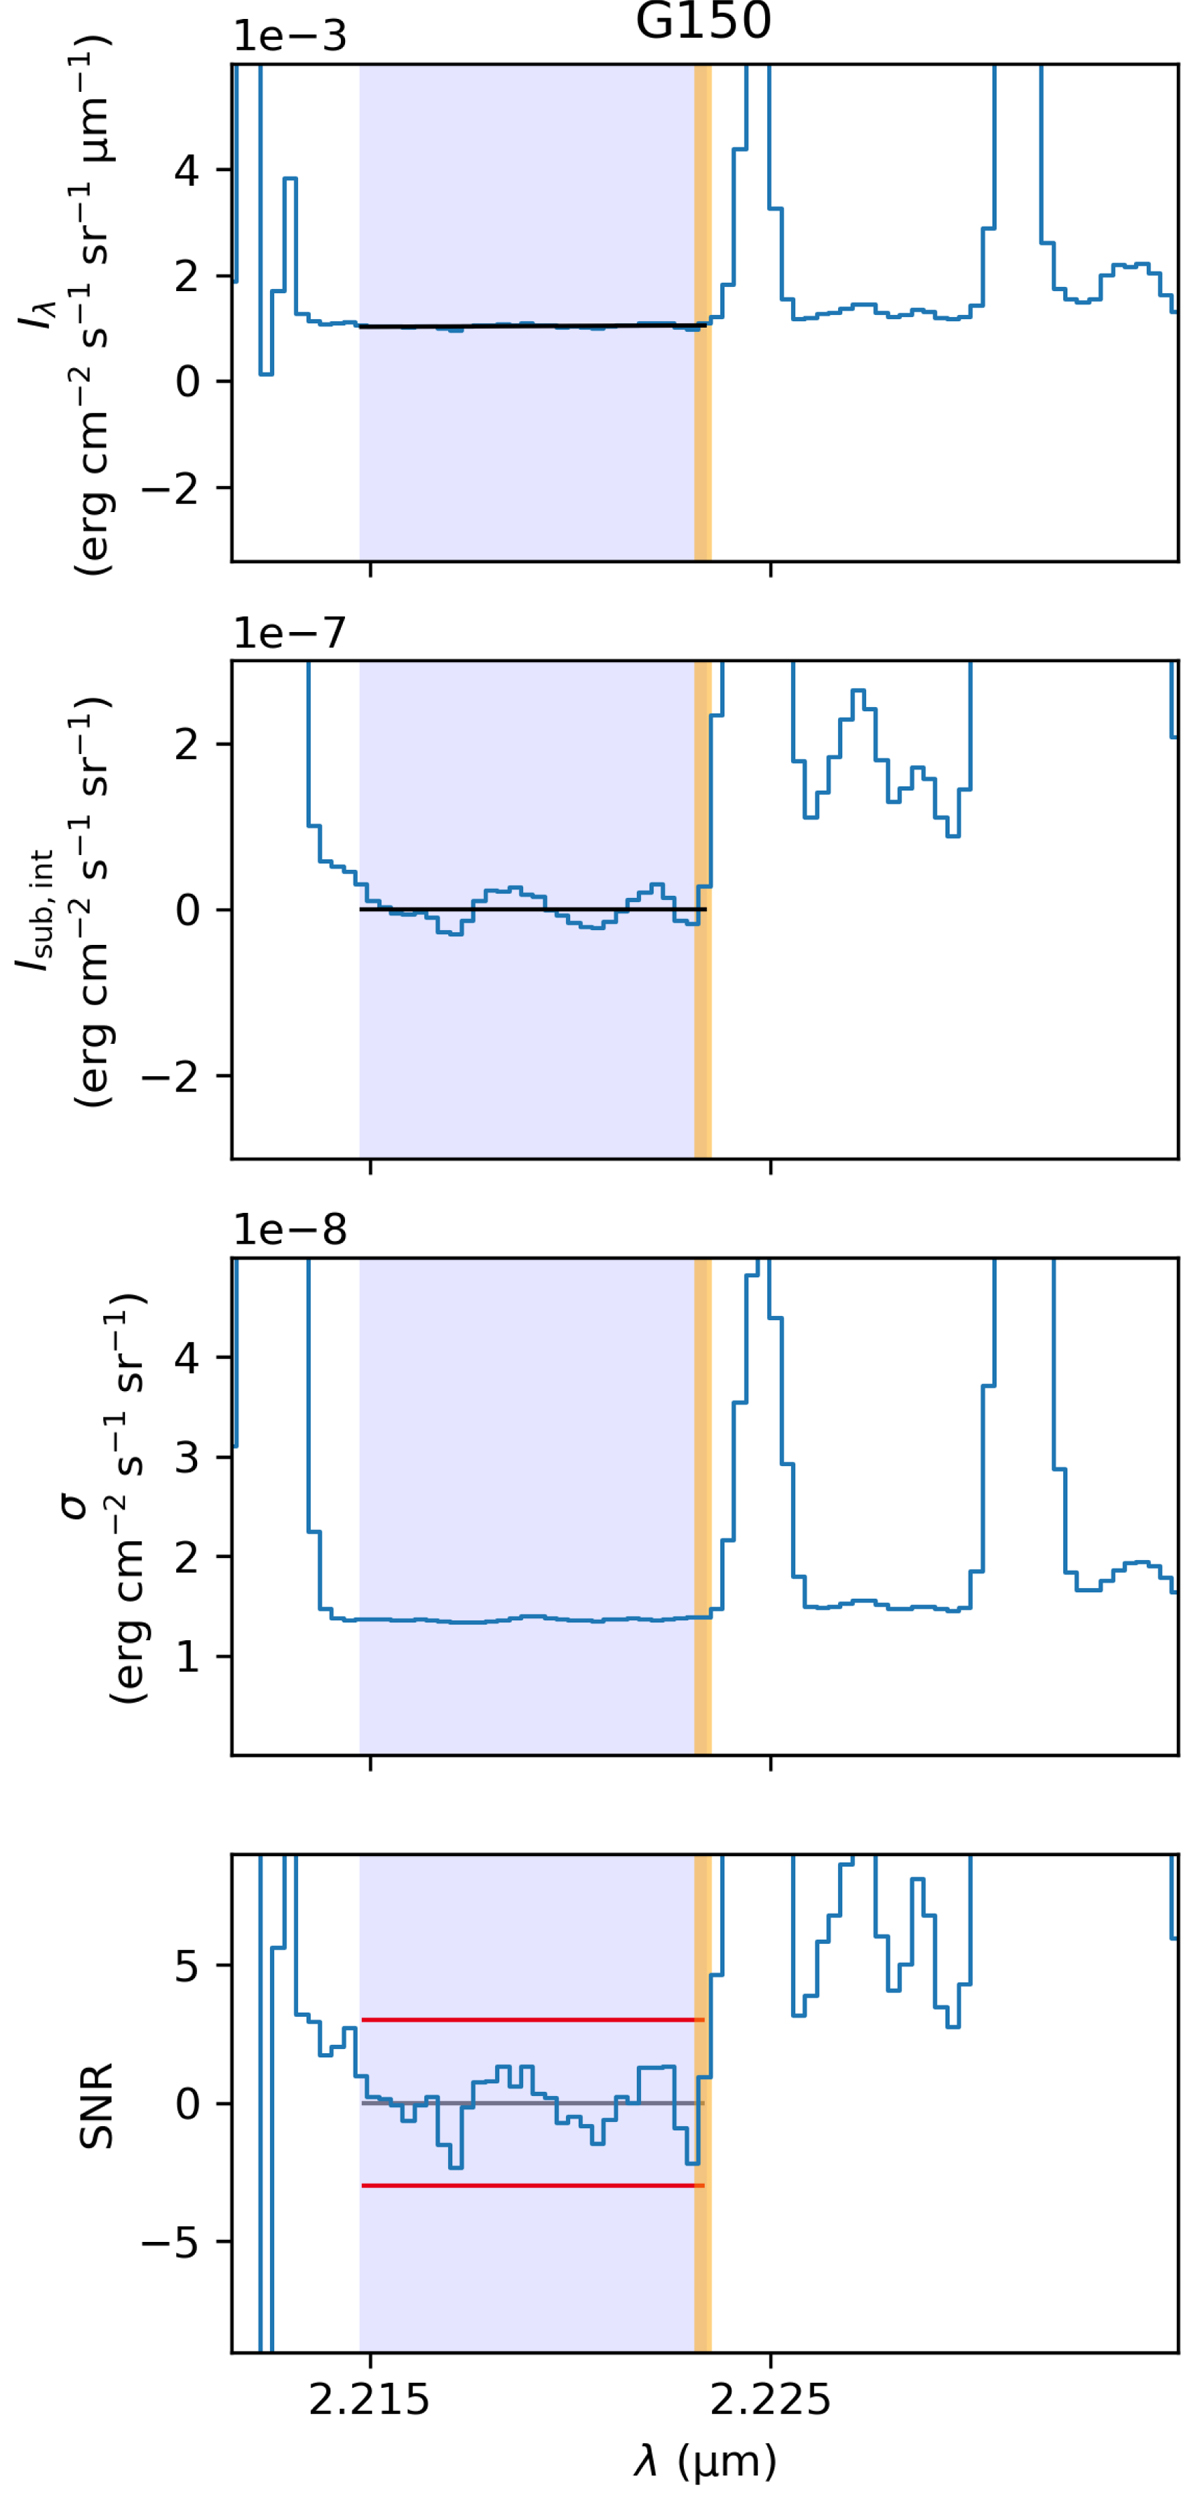
NIR spectrum of G150 (see Appendix A for the rest of the targets). Row 1: 1D spectrum for G150. The black line is a linear fit to Iλ in the region with no skylines (blue strip). The vertical orange strip is the wavelength of the (1 − 0)S(0) line. Row 2: Isub, int, the spectrum after we subtracted from it the linear fit and integrated over the instrument spectral resolution, Δλ ≈ 7.4 × 10⁻⁴ μm. Row 3: Error (noise) on Isub, int. Row 4: S/N = Isub, int/σ. Wavelengths are in vacuum.
Current usage metrics show cumulative count of Article Views (full-text article views including HTML views, PDF and ePub downloads, according to the available data) and Abstracts Views on Vision4Press platform.
Data correspond to usage on the plateform after 2015. The current usage metrics is available 48-96 hours after online publication and is updated daily on week days.
Initial download of the metrics may take a while.