Free Access
Fig. 1.
Download original image
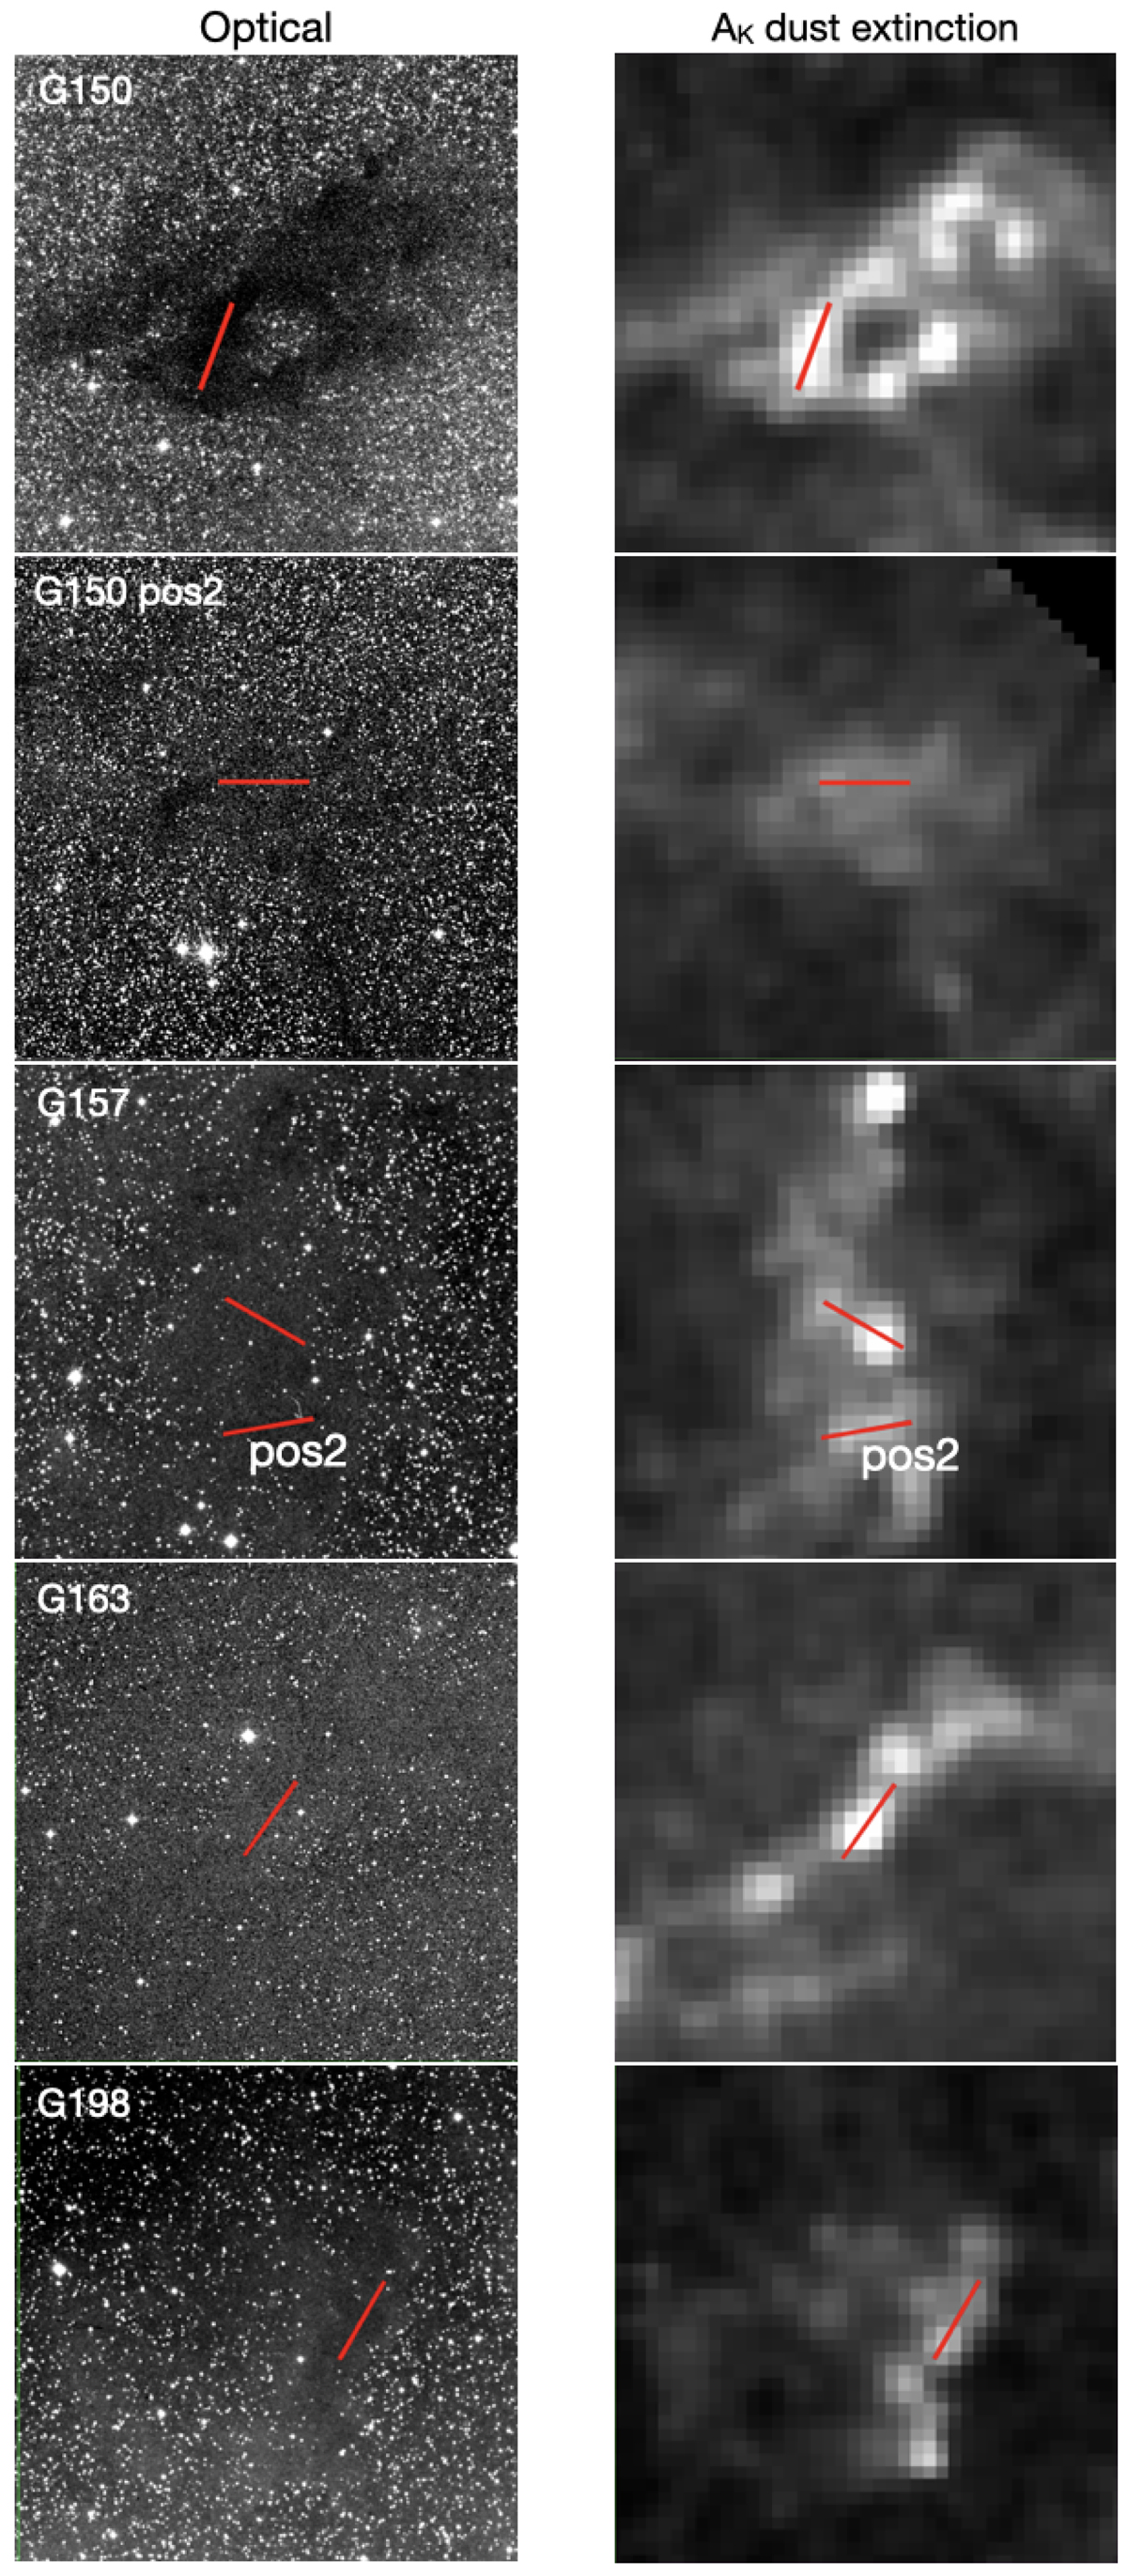
Optical image and NIR dust attenuation map for our target clouds. Images are from ESA-Sky (Baines et al. 2017), based on DSS and 2MASS (Skrutskie et al. 2006). Each panel is 40′×40′. The position of the 7′ slit is shown in red.
Current usage metrics show cumulative count of Article Views (full-text article views including HTML views, PDF and ePub downloads, according to the available data) and Abstracts Views on Vision4Press platform.
Data correspond to usage on the plateform after 2015. The current usage metrics is available 48-96 hours after online publication and is updated daily on week days.
Initial download of the metrics may take a while.