Fig. 8

Download original image
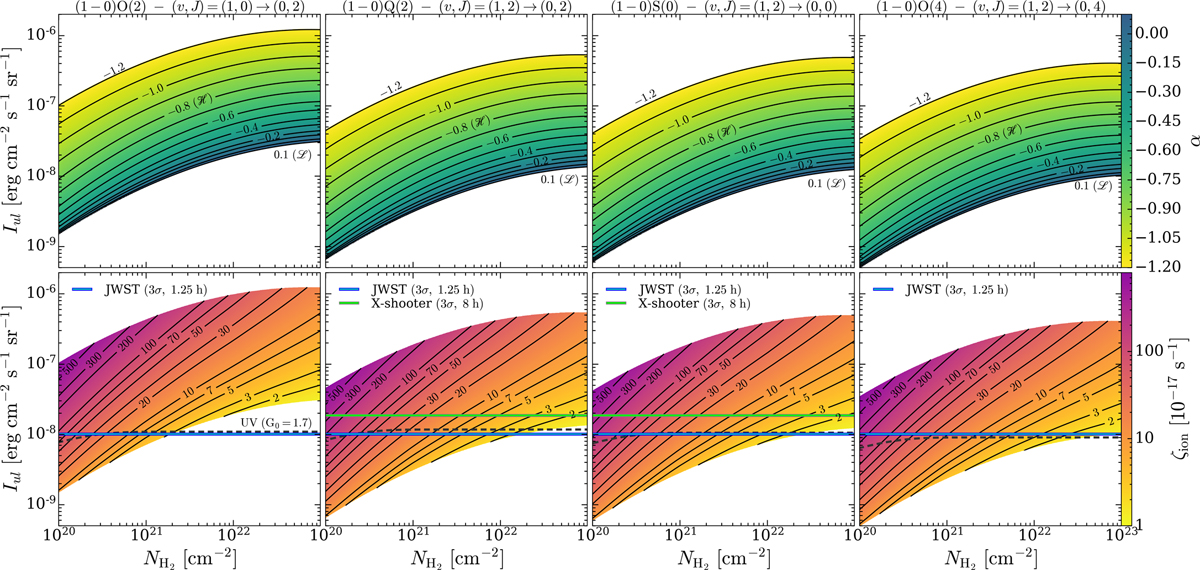
Maps of the low-energy spectral slope (α, upper row) and of the CR ionisation rate (ζion, lower row) as a function of the energy surface brightness expected by direct CR excitation for the four H2 rovibrational transitions listed in Table 1 and as a function of the H2 column density. We note that we assume ![]() . The dashed black lines show the expected brightness due to indirect excitation by interstellar UV photons for a far-UV radiation field with G0 = 1.7 (Draine 2011). Solid black lines show the iso-contours of α (upper panels) and ζion in units of 10−17 s−1 (lower panels). Solid blue horizontal lines show the JWST sensitivity for a signal-to-noise ratio of 3 over 1.25 h of integration, adding up the signal over 50 shutters. Solid green horizontal lines show the X-shooter sensitivity for a signal-to-noise ratio of 3 over 8 h of integration, adding up the signal over the whole slit.
. The dashed black lines show the expected brightness due to indirect excitation by interstellar UV photons for a far-UV radiation field with G0 = 1.7 (Draine 2011). Solid black lines show the iso-contours of α (upper panels) and ζion in units of 10−17 s−1 (lower panels). Solid blue horizontal lines show the JWST sensitivity for a signal-to-noise ratio of 3 over 1.25 h of integration, adding up the signal over 50 shutters. Solid green horizontal lines show the X-shooter sensitivity for a signal-to-noise ratio of 3 over 8 h of integration, adding up the signal over the whole slit.
Current usage metrics show cumulative count of Article Views (full-text article views including HTML views, PDF and ePub downloads, according to the available data) and Abstracts Views on Vision4Press platform.
Data correspond to usage on the plateform after 2015. The current usage metrics is available 48-96 hours after online publication and is updated daily on week days.
Initial download of the metrics may take a while.


