Fig. 6
Download original image
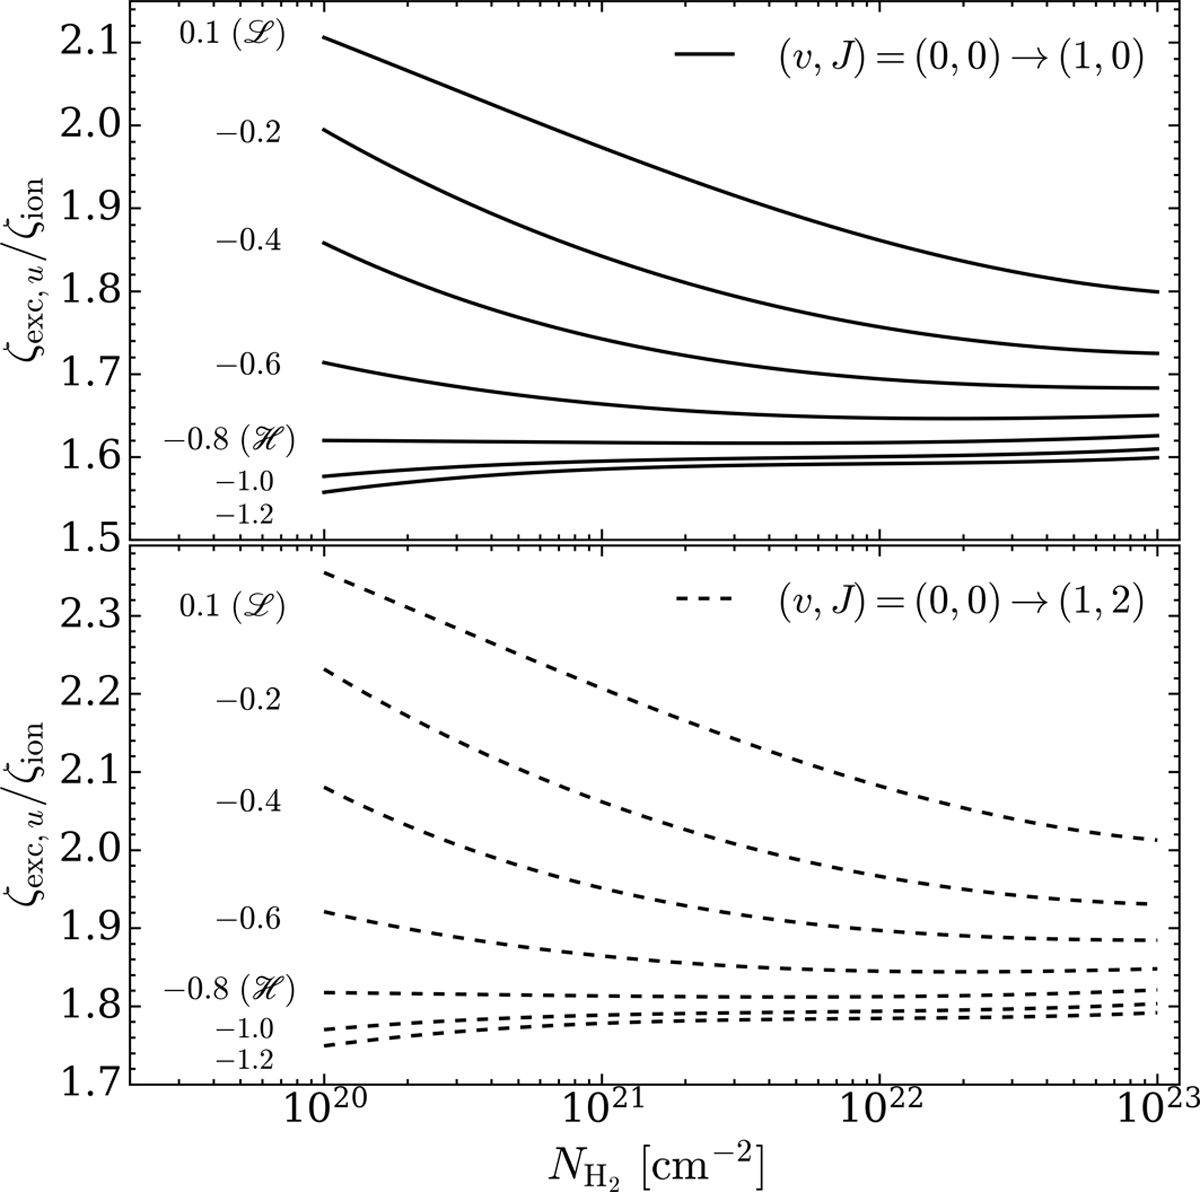
Ratio between the total CR excitation and ionisation rates as a function of H2 column density for the H2 rovibrational transitions (v, J) = (0, 0) → (1, 0) and (v, J) = (0, 0) → (1, 2) (upper and lower panel, respectively). Labels on the left denote the spectral energy slope at low energy (parameter α in Eq. (2)). The cases α = 0.1 and α = −0.8 correspond to models ![]() and
and ![]() , respectively.
, respectively.
Current usage metrics show cumulative count of Article Views (full-text article views including HTML views, PDF and ePub downloads, according to the available data) and Abstracts Views on Vision4Press platform.
Data correspond to usage on the plateform after 2015. The current usage metrics is available 48-96 hours after online publication and is updated daily on week days.
Initial download of the metrics may take a while.