Fig. 4
Download original image
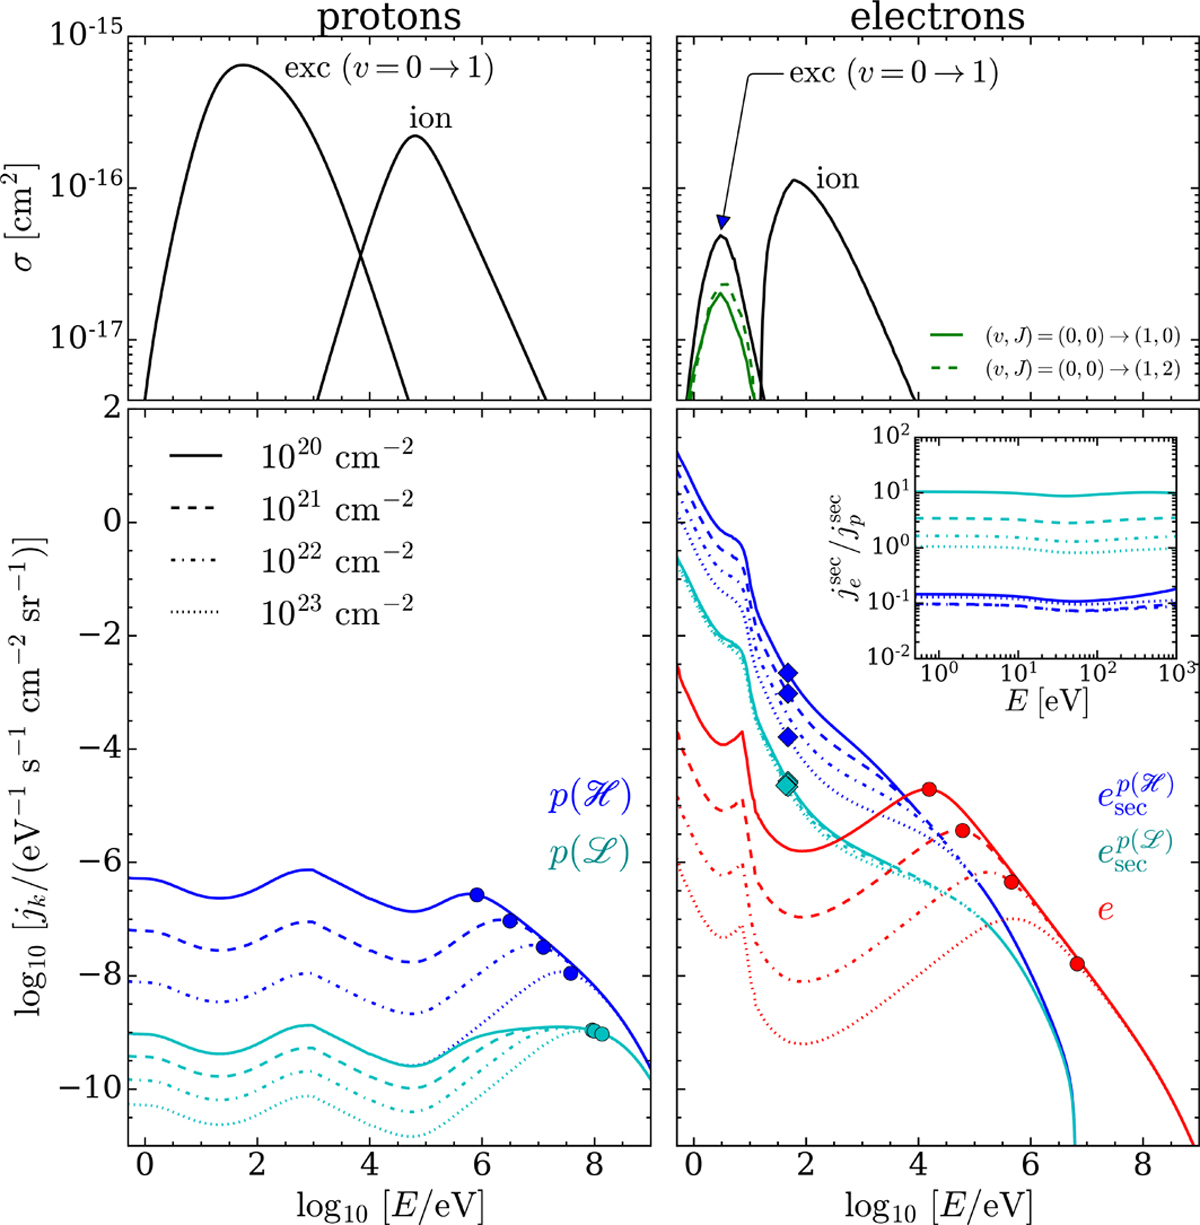
Ingredients for CR proton and electron excitation and ionisation rates: cross sections and propagated spectra. Upper panels: vibrational excitation, v = 0 → 1, and ionisation (‘ion’) cross sections for protons (left plot; Tabata & Shirai 2000 and Rudd et al. 1992, respectively) and for electrons (right plot; Yoon et al. 2008 and Kim et al. 2000, respectively) colliding with H2. Solid and dashed green lines show the rovibrational cross sections (v, J) = (0, 0) → (1, 0) and (v, J) = (0, 0) → (1, 2), respectively, from the MCCC calculations. Lower panels: CR spectra at the column densities
![]() , 1021, 1022, and 1023 cm−2 as a functionof the energy. The left plot shows CR protons (models
, 1021, 1022, and 1023 cm−2 as a functionof the energy. The left plot shows CR protons (models ![]() and
and ![]() ; cyan and blue lines, respectively) and the right plot shows CR primary electrons (e; red lines) and secondary electrons from CR protons (models
; cyan and blue lines, respectively) and the right plot shows CR primary electrons (e; red lines) and secondary electrons from CR protons (models ![]() and
and ![]() , labelled as
, labelled as ![]() and
and ![]() , respectively;cyan and blue lines). The inset shows the ratio between the secondary electron spectra generated by primary CR electrons,
, respectively;cyan and blue lines). The inset shows the ratio between the secondary electron spectra generated by primary CR electrons, ![]() , and by CR protons,
, and by CR protons, ![]() (same colour and line coding as the main plot). Solid circles and diamonds in the lower panels respectively denote the energies of primary CRs and secondary electrons that contribute most to the CR ionisation rate (see also Appendix B).
(same colour and line coding as the main plot). Solid circles and diamonds in the lower panels respectively denote the energies of primary CRs and secondary electrons that contribute most to the CR ionisation rate (see also Appendix B).
Current usage metrics show cumulative count of Article Views (full-text article views including HTML views, PDF and ePub downloads, according to the available data) and Abstracts Views on Vision4Press platform.
Data correspond to usage on the plateform after 2015. The current usage metrics is available 48-96 hours after online publication and is updated daily on week days.
Initial download of the metrics may take a while.