Fig. C.1
Download original image
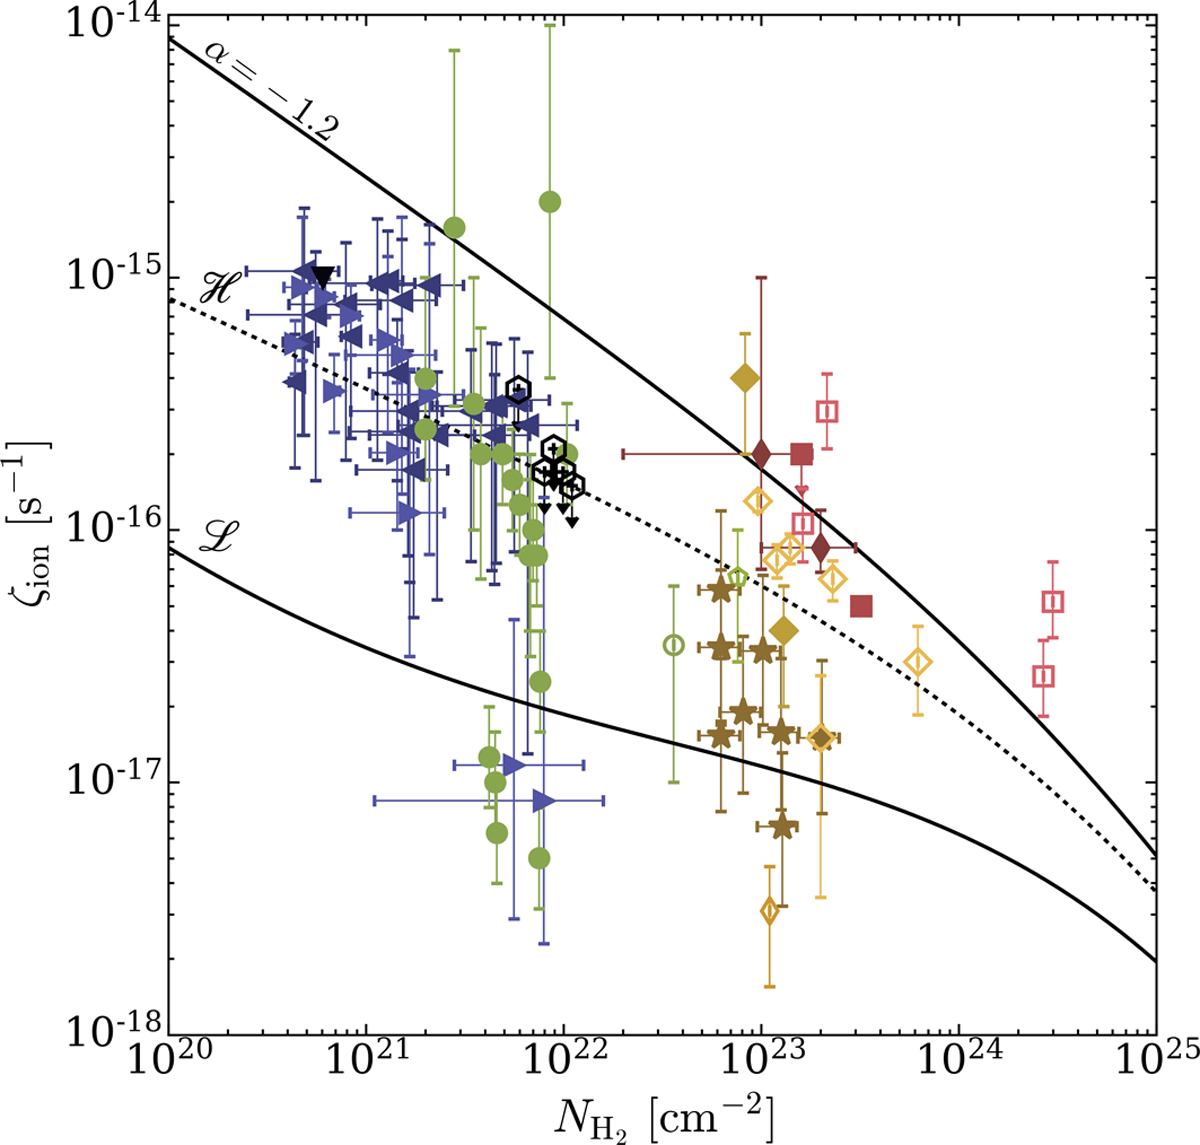
Total CR ionisation rate as a function of the H2 column density: theoretical model ![]() (solid black line), theoretical model
(solid black line), theoretical model ![]() (dotted black line), and with low-energy spectral slope α = −1.2 (solid black line). Expected values from models also include the ionisation due to primary CR electrons and secondary electrons. Observational estimates in diffuse clouds are shown with a downward-pointing triangle (Shaw et al. 2008), left-pointingtriangles (Indriolo & McCall 2012), and right-pointing triangles (Neufeld & Wolfire 2017). Observational estimates inlow-mass dense cores are shown as solid circles (Caselli et al. 1998), empty hexagons (Bialy et al. 2022), an empty circle (Maret & Bergin 2007), and an empty pentagon (Fuente et al. 2016). Observational estimates in high-mass star-forming regions are shown as stars (Sabatini et al. 2020), solid diamonds (de Boisanger et al. 1996), empty diamonds (van der Tak et al. 2000), empty thin diamonds (Hezareh et al. 2008), and solid thin diamonds (Morales Ortiz et al. 2014). Observational estimates in circumstellar discs are shown as solid squares (Ceccarelli et al. 2004)and in massive hot cores as empty squares (Barger & Garrod 2020).
(dotted black line), and with low-energy spectral slope α = −1.2 (solid black line). Expected values from models also include the ionisation due to primary CR electrons and secondary electrons. Observational estimates in diffuse clouds are shown with a downward-pointing triangle (Shaw et al. 2008), left-pointingtriangles (Indriolo & McCall 2012), and right-pointing triangles (Neufeld & Wolfire 2017). Observational estimates inlow-mass dense cores are shown as solid circles (Caselli et al. 1998), empty hexagons (Bialy et al. 2022), an empty circle (Maret & Bergin 2007), and an empty pentagon (Fuente et al. 2016). Observational estimates in high-mass star-forming regions are shown as stars (Sabatini et al. 2020), solid diamonds (de Boisanger et al. 1996), empty diamonds (van der Tak et al. 2000), empty thin diamonds (Hezareh et al. 2008), and solid thin diamonds (Morales Ortiz et al. 2014). Observational estimates in circumstellar discs are shown as solid squares (Ceccarelli et al. 2004)and in massive hot cores as empty squares (Barger & Garrod 2020).
Current usage metrics show cumulative count of Article Views (full-text article views including HTML views, PDF and ePub downloads, according to the available data) and Abstracts Views on Vision4Press platform.
Data correspond to usage on the plateform after 2015. The current usage metrics is available 48-96 hours after online publication and is updated daily on week days.
Initial download of the metrics may take a while.