Fig. B.1
Download original image
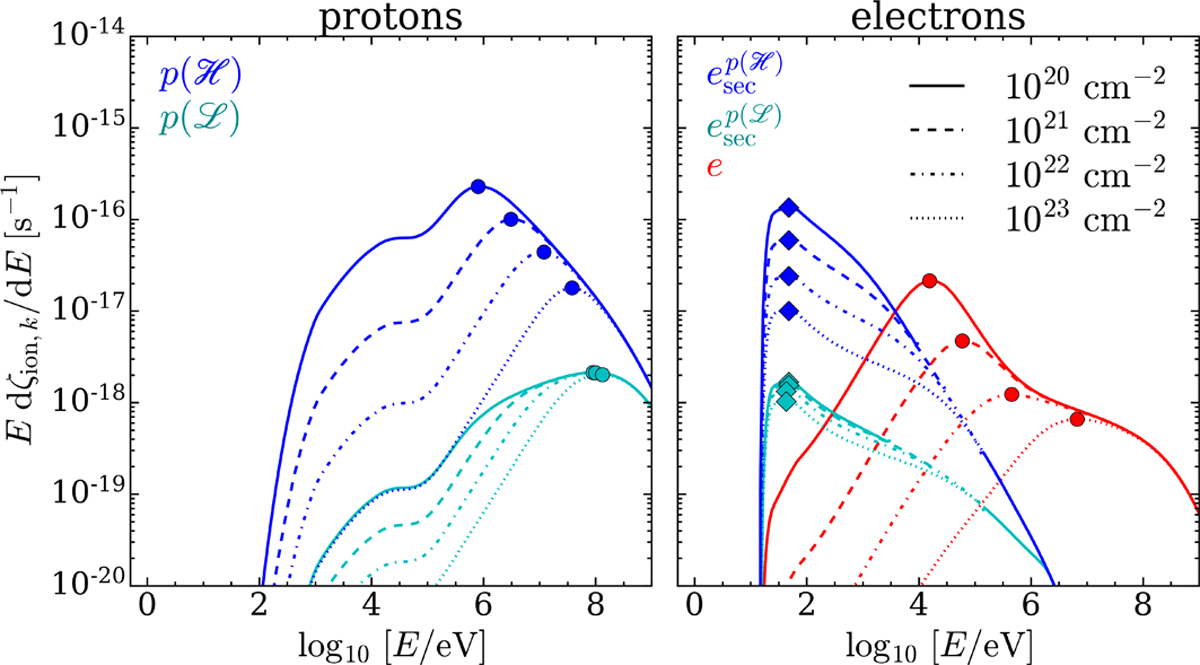
Differential contribution to the ionisation rate, Edζion,k∕dE, per logarithmic energy interval as a function of the energy at the column densities
![]() , 1021, 1022, and 1023 cm−2. Left plot: CR protons (models
, 1021, 1022, and 1023 cm−2. Left plot: CR protons (models ![]() and
and ![]() ; cyan and blue lines, respectively). Right plot: CR primary electrons (red lines) and secondary electrons (models
; cyan and blue lines, respectively). Right plot: CR primary electrons (red lines) and secondary electrons (models
![]() and
and ![]() ; cyan and blue lines, respectively). Solid circles and diamonds respectively denote the energies of primary CRs and secondary electrons that contribute most to the CR ionisation rate.
; cyan and blue lines, respectively). Solid circles and diamonds respectively denote the energies of primary CRs and secondary electrons that contribute most to the CR ionisation rate.
Current usage metrics show cumulative count of Article Views (full-text article views including HTML views, PDF and ePub downloads, according to the available data) and Abstracts Views on Vision4Press platform.
Data correspond to usage on the plateform after 2015. The current usage metrics is available 48-96 hours after online publication and is updated daily on week days.
Initial download of the metrics may take a while.