Fig. 1
Download original image
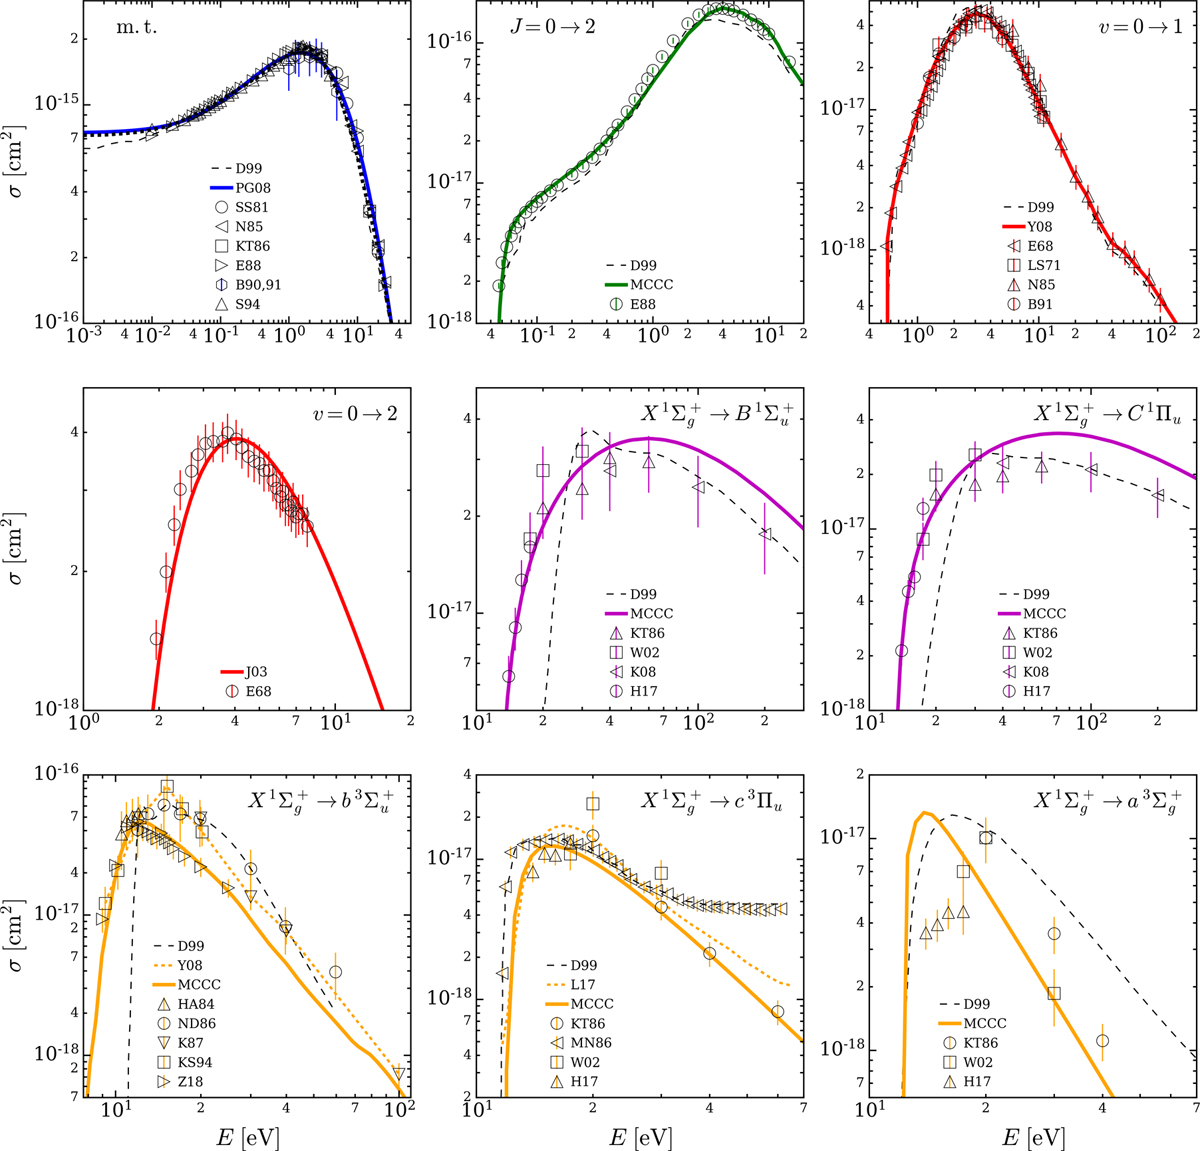
Theoretical and experimental cross sections for electrons colliding with H2. The cross sections used for the calculation of the energy loss function are displayed as thick lines, and those adopted by Dalgarno et al. (1999) (D99) as dashed black lines. From left to right and from top to bottom: momentum transfer cross section (‘m.t.’) computed by Pinto & Galli (2008) as a solid thick blue line (labelled as ‘PG08’), by Shyn & Sharp (1981) as circles (‘SS81’), by Nishimura et al. (1985) as left-pointing triangles (‘N85’), by Khakoo & Trajmar (1986) as squares (‘KT86’), by England et al. (1988) as right-pointing triangles (‘E88’), by Brunger et al. (1990, 1991) as hexagons (‘B90,91’), and by Schmidt et al. (1994) as upward-pointing triangles (‘S94’). The rotational transition J = 0 →2 is shown as a solid thick green line for the present MCCC calculations and as circles for the calculations by England et al. (1988) (‘E88’). The vibrational transition v = 0 → 1 is shown as a solid thick red line for Yoon et al. (2008) (‘Y08’), as left-pointing triangles for Ehrhardt et al. (1968) (‘E68’), as squares for Linder & Schmidt (1971) (‘LS71’), as upward-pointing triangles for Nishimura et al. (1985) (‘N85’), and as circles for Brunger et al. (1991) (‘B91’). The vibrational transition v = 0 → 2 is shown as a solid thick red line for the calculations by Janev et al. (2003) (‘J03’) and as circles for those by Ehrhardt et al. (1968) (‘E68’). The ![]() and
and ![]() singlet transitions are shown as a solid thick magenta line for the MCCC calculation from Scarlett et al. (2021a), as upward-pointing triangles for Khakoo & Trajmar (1986) (‘KT86’), as squares for Wrkich et al. (2002) (‘W02’), as left-pointing triangles for Kato et al. (2008) (‘K08’), and as circles for Hargreaves et al. (2017) (‘H17’). The
singlet transitions are shown as a solid thick magenta line for the MCCC calculation from Scarlett et al. (2021a), as upward-pointing triangles for Khakoo & Trajmar (1986) (‘KT86’), as squares for Wrkich et al. (2002) (‘W02’), as left-pointing triangles for Kato et al. (2008) (‘K08’), and as circles for Hargreaves et al. (2017) (‘H17’). The
![]() triplet transition is shown as a dotted orange line for Yoon et al. (2008) (‘Y08’), as a solid thick orange line for the MCCC calculations from Scarlett et al. (2021a), as upward-pointing triangles for Hall & Andric (1984) (‘HA84’), as circles for Nishimura & Danjo (1986) (‘ND86’), as downward-pointing triangles for Khakoo et al. (1987) (‘K87’), as squares for Khakoo & Segura (1994) (‘KS94’), and as right-pointing triangles for Zawadzki et al. (2018a) (‘Z18’). The
triplet transition is shown as a dotted orange line for Yoon et al. (2008) (‘Y08’), as a solid thick orange line for the MCCC calculations from Scarlett et al. (2021a), as upward-pointing triangles for Hall & Andric (1984) (‘HA84’), as circles for Nishimura & Danjo (1986) (‘ND86’), as downward-pointing triangles for Khakoo et al. (1987) (‘K87’), as squares for Khakoo & Segura (1994) (‘KS94’), and as right-pointing triangles for Zawadzki et al. (2018a) (‘Z18’). The
![]() triplet transition is shown as a dotted orange line for Liu et al. (2017) (‘L17’), a solid thick orange line for the MCCC calculations by Scarlett et al. (2021a), as circles for Khakoo & Trajmar (1986) (‘KT86’), as left-pointing triangles for Mason & Newell (1986) (‘MN86’), as squares for Wrkich et al. (2002) (‘W02’), and as upward-pointing triangles for Hargreaves et al. (2017) (‘H17’). The
triplet transition is shown as a dotted orange line for Liu et al. (2017) (‘L17’), a solid thick orange line for the MCCC calculations by Scarlett et al. (2021a), as circles for Khakoo & Trajmar (1986) (‘KT86’), as left-pointing triangles for Mason & Newell (1986) (‘MN86’), as squares for Wrkich et al. (2002) (‘W02’), and as upward-pointing triangles for Hargreaves et al. (2017) (‘H17’). The
![]() triplet transition is shown as a solid thick orange line for MCCC (Scarlett et al. 2021a), as circles for Khakoo & Trajmar (1986) (‘KT86’), as squares for Wrkich et al. (2002) (‘W02’), and as upward-pointing triangles for Hargreaves et al. (2017) (‘H17’).
triplet transition is shown as a solid thick orange line for MCCC (Scarlett et al. 2021a), as circles for Khakoo & Trajmar (1986) (‘KT86’), as squares for Wrkich et al. (2002) (‘W02’), and as upward-pointing triangles for Hargreaves et al. (2017) (‘H17’).
Current usage metrics show cumulative count of Article Views (full-text article views including HTML views, PDF and ePub downloads, according to the available data) and Abstracts Views on Vision4Press platform.
Data correspond to usage on the plateform after 2015. The current usage metrics is available 48-96 hours after online publication and is updated daily on week days.
Initial download of the metrics may take a while.