| Issue |
A&A
Volume 658, February 2022
|
|
|---|---|---|
| Article Number | A68 | |
| Number of page(s) | 8 | |
| Section | Extragalactic astronomy | |
| DOI | https://doi.org/10.1051/0004-6361/202142451 | |
| Published online | 03 February 2022 | |
Toward measuring the spin of obscured supermassive black holes
A critical assessment with disk megamasers
1
SISSA – International School for Advanced Studies, Via Bonomea 265, 34151 Trieste, Italy
e-mail: This email address is being protected from spambots. You need JavaScript enabled to view it.
2
INAF – Osservatorio di Astrofisica e Scienza dello Spazio di Bologna, Via Gobetti 93/3, 40129 Bologna, Italy
3
INAF – Osservatorio Astronomico di Brera, Via E. Bianchi 46, 23807 Merate, Italy
4
INFN – National Institute for Nuclear Physics, Via Valerio 2, 34127 Trieste, Italy
5
IFPU – Institute for Fundamental Physics of the Universe, Via Beirut 2, 34151 Trieste, Italy
Received:
15
October
2021
Accepted:
16
November
2021
Abstract
Context. Mass and spin are two fundamental properties of astrophysical black holes. While some established indirect methods are adopted to measure both these properties of active galactic nuclei (AGN) when viewed relatively face-on, very few suggested methods exist to measure these properties when AGN are highly inclined and potentially obscured by large amounts of gas.
Aims. In this context we explore the accuracy and performance of a recently proposed method to estimate the spin of AGN by fitting the accretion disk spectral energy distribution, when adapted for highly inclined and obscured systems, and in particular to a sample of six local water megamasers. For these sources the accretion rate and inclination angle are both known, allowing us to rely only on the AGN bolometric luminosity to infer their spin.
Methods. Using the bolometric luminosity as a proxy for the accretion disk peak luminosity, we derived the expected bolometric luminosity as a function of spin. Then, we measured the bolometric luminosity of each source through X-ray spectroscopy, and compared it with the expected value to constrain the spin of the AGN.
Results. The quality of the constraints depend critically on the accuracy of the measured bolometric luminosity, which is difficult to estimate in heavily obscured systems. Three out of six sources do not show consistency between the expected and measured bolometric luminosities, while the other three (four, when considering the [OIII] line as tracer of the bolometric luminosity) are formally consistent with high spin values.
Conclusions. Our results suggest that this method, although promising (and possibly considered as a future calibrator for other methods) needs better observational data and further theoretical modeling to be successfully applied to obscured AGN and to infer robust results.
Key words: galaxies: active
© ESO 2022
1. Introduction
A few decades of research demonstrated that the mass M• of supermassive black holes (SMBHs) at the center of active galactic nuclei (AGN) is a crucial parameter in estimating the cosmic history of accretion (Soltan 1982; Shankar et al. 2009), and that it correlates with the properties of their host galaxy bulges (Kormendy & Richstone 1995; Magorrian et al. 1998; Ferrarese & Merritt 2000; Gebhardt et al. 2000). These correlations are considered the final product of the co-evolution of SMBHs and galaxies (Reines & Volonteri 2015). The spin a, on the other hand, could also turn out to be of paramount importance to understand how SMBHs preferentially gain their mass through the cosmic history (Volonteri et al. 2013; Sesana et al. 2014). If the growth of a SMBH happens primarily through sustained prolonged accretion of matter, the coherent angular momentum of the accretion disk would spin it up. Conversely, if the mass growth is dominated by more chaotic and incoherent events, the final spin of the SMBH should be lower (Sesana et al. 2014). In addition, the rotational energy of a SMBH makes up a large reservoir that can be extracted (for example through the BZ process, Blandford & Znajek 1977) from its ergosphere, possibly powering the relativistic jets that are launched from the immediate vicinity of some AGN. Different observational methods are adopted to measure both the mass and spin of AGN when viewed relatively face-on. For instance, when the accretion disk and the broad-line region are directly visible, the AGN mass and spin can be inferred through the reverberation mapping technique (e.g., Grier et al. 2017) and the broadened shape of the iron Kα line, respectively (e.g., George & Fabian 1991; Reynolds 2019). Recently, Campitiello et al. (2018) proposed another way to constrain the spin and mass of a relatively unobscured AGN through fitting its accretion disk emission in the optical–UV portion of the spectral energy distribution (SED), the big blue bump (BBB), with a relativistic accretion model (kerrbb, Li et al. 2005). In particular, the peak frequency and intensity of the BBB depend on a combination of four parameters: the inner accretion rate Ṁ, BH mass M•, inclination angle of the system θ, and BH spin a. However, a large fraction of AGN have their accretion disk and broad-line region hidden by some amount of dusty obscuring gas, usually referred to as the torus (Merloni et al. 2014; Buchner et al. 2015). In these cases, the above-mentioned methods cannot be applied, and new possibilities need to be searched for and investigated.
Disk megamasers, which are AGN with water maser emission at a rest frame of 22 GHz tracing the Keplerian rotation of a subparsec-scale molecular disk orbiting the SMBH (e.g., Tarchi et al. 2012), are a subsample of local, heavily obscured AGN (Masini et al. 2016), but for which exquisitely precise M• and inclination angles are known (e.g., Kuo et al. 2011). Therefore, they offer a unique possibility to apply the SED fitting method, as two of the four unknown parameters are well determined. Disk megamasers opened a new and unique window on measuring BH masses for highly obscured and inclined systems (and have recently been used to calibrate a general method for obscured AGN; see Gliozzi et al. 2021), although measuring or even constraining their spins has been so far prohibitive (but see Giner & Loeb 2021, for a recent new suggestion to constrain their spin).
In this paper we adapt the SED fitting method of Campitiello et al. (2018) to explore its feasibility when applied to a few selected megamasers for which an independent estimate of the inclination angle θ, mass M•, accretion rate Ṁ, and bolometric luminosity Lbol exist or can be estimated from the literature. The paper is structured as follows. Section 2 presents the theoretical assumptions and lays the foundations of the method. Section 3 presents the sample considered in this work. In Sect. 4 our results are presented, and discussed in Sect. 5. Finally, we draw our conclusions in Sect. 6. Appendix A presents the details of our own spectral analysis and measurement of the X-ray luminosities. No cosmology is assumed since all distances are geometric, and uncertainties are quoted at a 1σ confidence level, unless otherwise stated.
2. Basic assumptions and methodology
When gas is accreted onto a BH, it is believed to form a disk whose angular momentum vector, at first order, aligns with the spin axis of the BH. In the inner disk regions the dynamics is regulated by the gravity of the massive rotating BH, and the spacetime metric is described by the Kerr metric (Kerr 1963). The method devised by Campitiello et al. (2018) relies on the numerical model kerrbb (Li et al. 2005), which is implemented in XSPEC (Arnaud 1996), though originally built for stellar mass BHs. This describes the emission from a thin, steady-state, general relativistic accretion disk around a rotating Kerr BH. It takes into account all the relativistic effects (i.e., Doppler beaming, gravitational redshift, light bending, self-irradiation, limb darkening), and the effects related to the black hole spin a that determines the innermost stable circular orbit (ISCO), which in turn regulates the radiative efficiency of the system. Campitiello et al. (2018) derived analytical formulae linking observables to the physical parameters. In particular, given a spin value a, mass M•, and accretion rate Ṁ, for a system observed at an angle θ, the frequency at which its accretion disk SED peaks νp, and its intensity (νLν)p can be expressed as
 (1)
(1)
 (2)
(2)
where log 𝒜 = 15.25, log ℬ = 45.66 (Calderone et al. 2013), Ṁ is measured in M⊙ yr−1 and M•, 9 in units of 109 M⊙, and the functions g1(a, θ) and g2(a, θ) encode the spin dependency of the observables and can be numerically computed with kerrbb, as explained below.
If for any reason the optical–UV SED of a given source is not observable or available, however, we can focus on Eq. (2) alone, and indirectly link the left-hand side of the equation to the bolometric luminosity of the system. First, we consider that  (Calderone et al. 2013), where
  is the observed accretion disk luminosity. Due to the angle-dependent emitted radiation pattern in the Kerr metric, the total and observed accretion disk luminosities differ:
  , where f(a, θ) encodes the spin and angular dependence of the emission. Throughout this work, its functional form and coefficients are adopted as reported in Table B.1 of Campitiello et al. (2018). Second, we take advantage of the self-similarity of accretion disk spectra, which implies the existence of relations among quantities at the peak frequencies, and the disk luminosity Ld. In particular, (νLν)p ≈ Ld/2 (see Eq. (A10) of Calderone et al. 2013). Thus,
 (3)
(3)
Hence, we can combine Eqs. (2) and (3), and express Lbol as a function of the other parameters:
 (4)
(4)
This last equation shows that, under the assumption that the bolometric luminosity is a proxy for the accretion disk peak luminosity, if one can independently estimate the bolometric luminosity, the accretion rate, and the inclination angle, it is possible to infer the spin of the BH, even if the SED emission of the BBB is not directly observed, since the functions f and g2 are functions of the spin alone once θ is known. More specifically, this can be done by comparing the predicted Lbol(a) given by Eq. (4) with the actual estimated value.
3. Sample selection
To successfully test Eq. (4) in constraining the spin without any optical–UV SED fitting, three observables are needed: the inclination angle of the system, its accretion rate, and its bolometric luminosity. As already mentioned, disk megamasers are an ideal test case, given their precise almost edge-on geometry which allows us to get a precise handle on their inclination angle. Moreover, the very fact that masers are detected implies very large obscuration in both the optical and X-ray bands, often above the Compton-thick threshold (NH ≳ 1024 cm−2, Masini et al. 2016, 2019), hence the optical SED is completely dominated by the host stellar light, preventing a measurement of both the peak frequency νp and intensity (νLν)p of their accretion disks.
Estimating the accretion rate Ṁ of obscured AGN is very difficult and model dependent, and not all disk megamasers have an estimate available. Kuo et al. (2018) presented a subsample of six disk megamasers (NGC 2960, NGC 4258, NGC 5765B, NGC 6264, NGC 6323, and UGC 3789) for which an indirect estimate of the black hole accretion rate Ṁ has also been derived. Specifically, the accretion rate was measured with the goal of assessing the relative importance of the maser disk mass in the BH mass determination (Kuo et al. 2018), adopting the model from Herrnstein et al. (2005). This model assumes a steady-state Shakura & Sunyaev (1973) accretion disk extending out to the radii where the masers are produced. At each maser spot location, the Keplerian velocity is dictated by the total (BH + disk) enclosed mass at that radius,
 (5)
(5)
where α is the Shakura & Sunyaev (1973) viscosity parameter;  is the sound speed, assumed to be
  km s−1, corresponding to a temperature suitable for maser emission (T = 700 ± 100 K); and Rin is the innermost maser radius. By fitting the Keplerian rotation curve v(r) of the maser spots, Kuo et al. (2018) obtain Mtot(r), from which the accretion rate is derived. Since no assumption is made over the viscosity parameter α, the inferred accretion rates are actually Ṁ/α; we discuss this caveat below. Hence, the only missing ingredient to derive the spin is the bolometric luminosity of the AGN in the Kuo et al. (2018) sample Lbol. Because of the paucity of information on the above quantities (whose uncertainties will be discussed later), the selected sample is ideal to assess the validity of the proposed approach.
One implicit assumption in selecting this particular sample is that the maser disk is well within the sphere of influence of the SMBH. We check this assumption by investigating how each maser disk size compares with respect to the gravitational sphere of influence of its central SMBH. The radius of the sphere of influence is defined as rinfl = GM•/σ2, where σ is the stellar velocity dispersion in the nuclear region of each galaxy, as reported by Greene et al. (2016). Table 1 shows that the outer maser radii of the sources in our sample are always well within the radii of influence of their respective SMBHs, which span roughly an order of magnitude (rinfl ∼ 1.9 − 13 pc). Hence, the dynamics is dominated by the gravity of the SMBH.
Sample considered in this work.
In the following, we briefly present the properties and the (indirect) estimates of the luminosity of the sources. The bolometric luminosity is derived from the X-ray coronal luminosity by applying a single bolometric correction kbol = 20, appropriate for the range of X-ray luminosity of our sources (Lusso et al. 2012; Duras et al. 2020). We compare our X-ray-based bolometric luminosities with those derived through the [OIII]λ5007 forbidden optical line (hereafter [OIII]), as reported by Kuo et al. (2020). Details of our own spectral analysis are given in Appendix A, while useful information about the sample is summarized in Table 1.
3.1. NGC 2960
NGC 2960 is a nearby spiral galaxy (z = 0.01645, de Vaucouleurs et al. 1991) whose nucleus hosts a SMBH of M• = 1.16 ± 0.05 × 10⁷ M⊙. The maser disk, discovered by Henkel et al. (2002), is highly inclined (Kuo et al. 2011; Impellizzeri et al. 2012) and likely responsible for the large obscuration affecting the nuclear emission. In the X-ray band a short NuSTAR snapshot (20 ks) is presented by Masini et al. (2016) that points to high obscuration, but is inconclusive about the Compton-thick nature of the AGN. A reanalysis of the broadband (0.2 − 70 keV) XMM-Newton + NuSTAR spectrum with the most up-to-date toroidal modeling gives a bolometric luminosity  erg s−1.
3.2. NGC 4258
NGC 4258, at a distance of D ∼ 7.6 Mpc (Humphreys et al. 2013), is considered the archetypal disk megamaser, discovered almost three decades ago and extremely well studied ever since (Miyoshi et al. 1995; Gammie et al. 1999; Herrnstein et al. 2005; Humphreys et al. 2013). Among the closest disk megamasers, it has been observed at almost all wavelengths. Despite its uniqueness, it is not the most representative example of the disk megamaser class, being only moderately obscured in the X-ray band (≲1023 cm−2, Fruscione et al. 2005), and possibly powered by a radiatively inefficient accretion flow (RIAF; Lasota et al. 1996; Herrnstein et al. 1998; Gammie et al. 1999; Yuan et al. 2002). Different papers point toward a bolometric luminosity Lbol ∼ 1042 erg s−1; here we adopt an X-ray derived Lbol ∼ 6 ± 1 × 1041 erg s−1 (Masini et al., in prep.; Fruscione et al. 2005).
3.3. NGC 5765B
NGC 5765B is part of a merging pair of late type galaxies at z = 0.02754 (Ahn et al. 2012). The megamaser disk is extensively studied in Gao et al. (2016), and it is the largest of the sample considered here, extending out to ∼1.2 pc from the nucleus. The broadband X-ray spectrum and a discussion on the AGN bolometric luminosity and Eddington ratio are presented by Masini et al. (2019), and we adopt here an X-ray derived  erg s−1.
3.4. NGC 6264
NGC 6264 is the farthest galaxy in the sample, at a distance of D ∼ 144 Mpc (Kuo et al. 2013). Its central AGN is likely very obscured, with an obscuring column density over the Compton-thick threshold as measured with XMM-Newton data alone (Castangia et al. 2013). Our own reanalysis of the XMM-Newton spectrum gives  erg s−1.
3.5. NGC 6323
The maser spots in the nucleus of NGC 6323 (D ∼ 107 Mpc, Kuo et al. 2015) trace an edge-on Keplerian disk orbiting around a  SMBH (Kuo et al. 2015). To obtain an estimate of the bolometric luminosity we analyzed an archival XMM-Newton snapshot of ∼20 ks. The tentative inferred value is
  erg s−1.
3.6. UGC 3789
Until the relatively recent discovery of water megamasers in its nucleus, UGC 3789 (D ∼ 49.6 Mpc, Reid et al. 2013) was not known to host an AGN (Braatz & Gugliucci 2008). Later on, UGC 3789 became a key galaxy to measure and refine the Hubble constant measurement using its masers (Reid et al. 2009, 2013; Braatz et al. 2010). Similarly to NGC 6264, Castangia et al. (2013) found evidence of heavy obscuration (possibly Compton-thick) using XMM-Newton data. A reanalysis of the XMM-Newton spectrum returns a bolometric luminosity  erg s−1.
4. Results
Once θ and Ṁ are known, we need to compute numerically the function g2 through kerrbb to get the expected Lbol as a function of spin, to be compared with the values we measured in the previous section. In using kerrbb, we assume a standard Keplerian disk with zero torque at the inner boundary (i.e., parameter eta of kerrbb is fixed to zero), and we include the effects of self-irradiation and limb darkening (by setting the kerrbb rflag and lflag parameters, respectively, to one). Then, kerrbb is run over a grid of spin values; using Eq. (2) we derive the function g2 for a given pair of (M•, Ṁ) adopted in XSPEC. The inclination angle θ is always fixed to 85°, which is the model maximum allowed value (except for NGC 4258, for which θ = 72° is reported, Humphreys et al. 2013). We do not expect this to significantly impact our conclusions for the range of observed inclination angles of our sources, but we discuss this point further in Sect. 5.
The uncertainty on Ṁ largely affects the spread over the expected Lbol, which translates in an uncertainty on the spin value when compared with the measured bolometric luminosity. As shown in Fig. 1, the expected bolometric luminosity increases with increasing spin, as does the radiative efficiency. At face value the results point toward generally large spin values, owing to the large uncertainty on the luminosity. A unique behavior is observed for NGC 4258, which is arguably the most peculiar disk megamaser, presenting the lowest inclination angle, the lowest obscuration along the line of sight, and the lowest accretion rate in Eddington units (see Table 1), likely in the RIAF regime (where we would not expect the assumptions underlying kerrbb to be valid1). For NGC 6323 and UGC 3789 instead there is no formal agreement between the expected luminosities and their X-ray measured values. On the other hand, NGC 2960, NGC 5765B, and NGC 6264 are formally consistent with a maximum spin value.
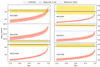 |
Fig. 1. Bolometric luminosity–spin plane for the six megamasers considered in this work. In each panel the red line and area give the expected Lbol based on Eq. (4), while the value we adopted or measured is shown by the dashed black line (and its 1σ uncertainty in yellow). We also plot the bolometric luminosity as measured from the [OIII] line (Kuo et al. 2020) as dotted blue lines. In two cases (NGC 4258, UGC 3789) there is no formal solution between the expected and measured luminosities, while for NGC 6323 the two luminosities differ by more than an order of magnitude. |
5. Discussion
The results presented in the previous section are inevitably tentative at this stage, given the significant caveats and limitations, which we discuss in the following.
First of all, it is worth noting that the uncertainty on the measured Lbol is inferred from the intrinsic X-ray luminosity alone; in other words, we have assumed a single bolometric correction kbol = 20, suitable for the Seyfert-like luminosity of our sources (Lusso et al. 2012; Duras et al. 2020). The uncertainty on the intrinsic X-ray luminosity has been estimated from that of the normalization of the coronal power law of the X-ray spectroscopic analysis (Appendix A). Including the scatter on the correlation between the X-ray and the bolometric luminosity would broaden the yellow stripes in Fig. 1 by a factor of at least two. However, we also plot in Fig. 1 all the [OIII]-derived bolometric luminosities as reported by Kuo et al. (2020); they are fully consistent with the X-ray-derived bolometric luminosities in all cases but NGC 6323. For this source the [OIII]-derived bolometric luminosity suggests that the intrinsic X-ray luminosity of this AGN might be overestimated, and adopting the lower bolometric luminosity suggests a maximum spin value for NGC 6323 as well.
Furthermore, accurately measuring the inclination angle is very important for the successful application of this kind of analysis. In the previous section we implicitly assume that the maser and inner accretion disks are co-planar. However, in principle their inclinations could significantly differ if some strong warping inside of the inner masing radius were present. This possibility can be tested by measuring the difference in position angle (PA) between the nuclear jets and the disk itself. Of the six sources in our sample, three have a detection of either parsec- or kiloparsec-scale jets, and they are all consistent with being co-planar to the inner accretion disk. Herrnstein et al. (2005) show that the core radio emission at 22 GHz is perpendicular to the maser disk in NGC 4258, and Greene et al. (2013) show that the PA difference between the maser disk and the kiloparsec-scale jets in UGC 3789 and NGC 2960 are both ∼80° −90°. We note that Kamali et al. (2019) find that the jet in NGC 2960 is misaligned by about 70° with respect to the masers; in this case (i.e., assuming an inclination of 65° instead of 85° for NGC 2960), we find that its spin becomes consistent with lower values (a < 0.8). For the other three sources considered here, there is no jet detection or radio continuum morphology reported in the literature, but Greene et al. (2013) demonstrated that megamaser disks are generally perpendicular to jets, thereby suggesting that the inclinations of the maser and the inner accretion disks are similar.
The accretion rate reported by Kuo et al. (2018) and in the model of Herrnstein et al. (2005) is defined as Ṁ/α, where α is the viscosity parameter of the Shakura & Sunyaev (1973) accretion disk model. A typical value for α found in numerical simulations of the inner regions of accretion disks and from theoretical considerations is in the range ∼0.01 − 0.4 (King et al. 2007), while here we implicitly assume that Ṁ/α = Ṁ at the inner maser radius (i.e., α = 1). It is unlikely that Ṁ/α measured at the inner maser radius (i.e., at ∼105rg) is comparable with that close to the ISCO, unless the steady-state condition of the disk is satisfied for a viscous timescale of tv ∼ 109 yr (e.g., Gammie et al. 1999). However, although the state of the art numerical simulations do not trace the evolution of such quantities at large distance from the SMBH, it is not unreasonable to think that both the accretion rate (e.g., due to variability and/or mass loss through winds) and the viscosity parameter should decrease closer to the BH horizon (Penna et al. 2013). If so, their ratio could in principle be consistent with that measured at the inner maser radius.
Very recently, Giner & Loeb (2021) proposed estimating the spins of a sample of disk megamasers from the absence of Lense-Thirring precession (Lense & Thirring 1918) at the inner maser radius. Three of their sources are in common with ours. While we find consistent results for the spin of NGC 5765B, we are not able to set meaningful constraints for both NGC 4258 and UGC 3789. While the lack of constraints for NGC 4258 might be expected given the likely low radiatively efficient nature of its accretion flow (Yuan et al. 2002), the reason for a lack of solution for UGC 3789 is not clear (and similarly for NGC 6323, which is not, however, in the sample of Giner & Loeb 2021). The bolometric luminosity might be overestimated (in particular for NGC 6323, as mentioned earlier, which results super-Eddington, as shown in Table 1) if it were the column density, but we consider this possibility unlikely given the strong obscuration signatures in the X-ray spectra of the vast majority of disk megamasers. The observed discrepancy could lie in the mentioned unknown value of α at large scales. If the issue were related to the adopted bolometric correction, a simple estimate shows that the assumption of a bolometric correction of 10 instead of 20 would make UGC 3789 barely consistent with the most extreme prograde spin value, shifting down the measured Lbol of ∼0.25 dex.
6. Conclusions
In this paper we proposed a method for constraining the spin of obscured AGN, specifically disk megamasers. This relies on the fact that in such sources the BH mass and inclination are well determined, and the accretion rate has been estimated through the dynamics of the maser spots. We explored both its theoretical and observational applicability. We note that the work presented proposes the new approach and procedure (somewhat alternative and complementary to the approach proposed by Giner & Loeb 2021), rather than effectively determining individual spins. In particular, we first adapted the equations for sources where the accretion disk emission is not observed in the broadband SED. Then we selected a sample of six well-known local obscured AGN for which the accretion rate was estimated through dynamical fitting of their water maser emission. Comparing the expected bolometric luminosities with the estimated values resulted in three sources (possibly four, considering the bolometric luminosities measured from the [OIII] line) being consistent with large spin values, while in two other sources no constraints can be set. The results, although tentative, suggest that the method could be successfully applied to obscured AGN, provided the underlying assumptions (most importantly the role and meaning of the accretion disk viscosity parameter) are explored and tested. It is worth noting that more stringent results could be obtained by directly detecting the BBB signature in the SED using polarized light (e.g., Antonucci & Miller 1985).
A larger bolometric correction (kbol > 20) would be needed to shift up the measured Lbol, allowing a formal solution with the predicted curve. However, this possibility seems unlikely given the known scaling of kbol with X-ray luminosity (Netzer 2019; Duras et al. 2020).
Acknowledgments
We thank the referee for an incredibly useful and kind report. Their suggestions made this paper stronger and clearer. This research has made use of observations obtained with XMM-Newton, an ESA science mission with instruments and contributions directly funded by ESA Member States and NASA. This work made also use of data from the NuSTAR mission, a project led by the California Institute of Technology, managed by the Jet Propulsion Laboratory, and funded by the National Aeronautics and Space Administration, as well as the NuSTAR Data Analysis Software (NuSTARDAS) jointly developed by the ASI Science Data Center (ASDC, Italy) and the California Institute of Technology (USA).
References
- Ahn, C. P., Alexandroff, R., Allende Prieto, C., et al. 2012, ApJS, 203, 21 [Google Scholar]
- Antonucci, R. R. J., & Miller, J. S. 1985, ApJ, 297, 621 [NASA ADS] [CrossRef] [Google Scholar]
- Arnaud, K. A. 1996, in Astronomical Data Analysis Software and Systems V, eds. G. H. Jacoby, & J. Barnes, ASP Conf. Ser., 101, 17 [NASA ADS] [Google Scholar]
- Baloković, M., Brightman, M., Harrison, F. A., et al. 2018, ApJ, 854, 42 [Google Scholar]
- Blandford, R. D., & Znajek, R. L. 1977, MNRAS, 179, 433 [NASA ADS] [CrossRef] [Google Scholar]
- Braatz, J. A., & Gugliucci, N. E. 2008, ApJ, 678, 96 [NASA ADS] [CrossRef] [Google Scholar]
- Braatz, J. A., Reid, M. J., Humphreys, E. M. L., et al. 2010, ApJ, 718, 657 [NASA ADS] [CrossRef] [Google Scholar]
- Buchner, J., Georgakakis, A., Nandra, K., et al. 2015, ApJ, 802, 89 [Google Scholar]
- Calderone, G., Ghisellini, G., Colpi, M., & Dotti, M. 2013, MNRAS, 431, 210 [NASA ADS] [CrossRef] [Google Scholar]
- Campitiello, S., Ghisellini, G., Sbarrato, T., & Calderone, G. 2018, A&A, 612, A59 [NASA ADS] [CrossRef] [EDP Sciences] [Google Scholar]
- Cash, W. 1979, ApJ, 228, 939 [Google Scholar]
- Castangia, P., Panessa, F., Henkel, C., Kadler, M., & Tarchi, A. 2013, MNRAS, 436, 3388 [NASA ADS] [CrossRef] [Google Scholar]
- de Vaucouleurs, G., de Vaucouleurs, A., Corwin, Jr., H. G., et al. 1991, Third Reference Catalogue of Bright Galaxies (New York: Springer) [Google Scholar]
- Duras, F., Bongiorno, A., Ricci, F., et al. 2020, A&A, 636, A73 [NASA ADS] [CrossRef] [EDP Sciences] [Google Scholar]
- Ferrarese, L., & Merritt, D. 2000, ApJ, 539, L9 [Google Scholar]
- Fruscione, A., Greenhill, L. J., Filippenko, A. V., et al. 2005, ApJ, 624, 103 [NASA ADS] [CrossRef] [Google Scholar]
- Gammie, C. F., Narayan, R., & Blandford, R. 1999, ApJ, 516, 177 [NASA ADS] [CrossRef] [Google Scholar]
- Gao, F., Braatz, J. A., Reid, M. J., et al. 2016, ApJ, 817, 128 [NASA ADS] [CrossRef] [Google Scholar]
- Gebhardt, K., Bender, R., Bower, G., et al. 2000, ApJ, 539, L13 [Google Scholar]
- George, I. M., & Fabian, A. C. 1991, MNRAS, 249, 352 [Google Scholar]
- Giner, S., & Loeb, A. 2021, ArXiv e-prints [arXiv:2104.05084] [Google Scholar]
- Gliozzi, M., Williams, J. K., & Michel, D. A. 2021, MNRAS, 502, 3329 [NASA ADS] [CrossRef] [Google Scholar]
- Greene, J. E., Seth, A., den Brok, M., et al. 2013, ApJ, 771, 121 [NASA ADS] [CrossRef] [Google Scholar]
- Greene, J. E., Seth, A., Kim, M., et al. 2016, ApJ, 826, L32 [NASA ADS] [CrossRef] [Google Scholar]
- Grier, C. J., Trump, J. R., Shen, Y., et al. 2017, ApJ, 851, 21 [NASA ADS] [CrossRef] [Google Scholar]
- Henkel, C., Braatz, J. A., Greenhill, L. J., & Wilson, A. S. 2002, A&A, 394, L23 [NASA ADS] [CrossRef] [EDP Sciences] [Google Scholar]
- Herrnstein, J. R., Greenhill, L. J., Moran, J. M., et al. 1998, ApJ, 497, L69 [NASA ADS] [CrossRef] [Google Scholar]
- Herrnstein, J. R., Moran, J. M., Greenhill, L. J., & Trotter, A. S. 2005, ApJ, 629, 719 [NASA ADS] [CrossRef] [Google Scholar]
- Humphreys, E. M. L., Reid, M. J., Moran, J. M., Greenhill, L. J., & Argon, A. L. 2013, ApJ, 775, 13 [Google Scholar]
- Impellizzeri, C. M. V., Braatz, J. A., Kuo, C. Y., et al. 2012, in Cosmic Masers - from OH to H0, eds. R. S. Booth, W. H. T. Vlemmings, & E. M. L. Humphreys, 287, 311 [Google Scholar]
- Kalberla, P. M. W., Burton, W. B., Hartmann, D., et al. 2005, A&A, 440, 775 [NASA ADS] [CrossRef] [EDP Sciences] [Google Scholar]
- Kamali, F., Henkel, C., Koyama, S., et al. 2019, A&A, 624, A42 [NASA ADS] [CrossRef] [EDP Sciences] [Google Scholar]
- Kerr, R. P. 1963, Phys. Rev. Lett., 11, 237 [Google Scholar]
- King, A. R., Pringle, J. E., & Livio, M. 2007, MNRAS, 376, 1740 [NASA ADS] [CrossRef] [Google Scholar]
- Kormendy, J., & Richstone, D. 1995, ARA&A, 33, 581 [Google Scholar]
- Kuo, C. Y., Braatz, J. A., Condon, J. J., et al. 2011, ApJ, 727, 20 [NASA ADS] [CrossRef] [Google Scholar]
- Kuo, C. Y., Braatz, J. A., Reid, M. J., et al. 2013, ApJ, 767, 155 [NASA ADS] [CrossRef] [Google Scholar]
- Kuo, C. Y., Braatz, J. A., Lo, K. Y., et al. 2015, ApJ, 800, 26 [NASA ADS] [CrossRef] [Google Scholar]
- Kuo, C. Y., Constantin, A., Braatz, J. A., et al. 2018, ApJ, 860, 169 [NASA ADS] [CrossRef] [Google Scholar]
- Kuo, C. Y., Braatz, J. A., Impellizzeri, C. M. V., et al. 2020, MNRAS, 498, 1609 [NASA ADS] [CrossRef] [Google Scholar]
- Lasota, J. P., Abramowicz, M. A., Chen, X., et al. 1996, ApJ, 462, 142 [NASA ADS] [CrossRef] [Google Scholar]
- Lense, J., & Thirring, H. 1918, Phys. Z., 19, 156 [Google Scholar]
- Li, L.-X., Zimmerman, E. R., Narayan, R., & McClintock, J. E. 2005, ApJS, 157, 335 [NASA ADS] [CrossRef] [Google Scholar]
- Lusso, E., Comastri, A., Simmons, B. D., et al. 2012, MNRAS, 425, 623 [Google Scholar]
- Magorrian, J., Tremaine, S., Richstone, D., et al. 1998, AJ, 115, 2285 [Google Scholar]
- Masini, A., Comastri, A., Baloković, M., et al. 2016, A&A, 589, A59 [NASA ADS] [CrossRef] [EDP Sciences] [Google Scholar]
- Masini, A., Comastri, A., Hickox, R. C., et al. 2019, ApJ, 882, 83 [Google Scholar]
- Merloni, A., Bongiorno, A., Brusa, M., et al. 2014, MNRAS, 437, 3550 [Google Scholar]
- Miyoshi, M., Moran, J., Herrnstein, J., et al. 1995, Nature, 373, 127 [NASA ADS] [CrossRef] [Google Scholar]
- Netzer, H. 2019, MNRAS, 488, 5185 [NASA ADS] [CrossRef] [Google Scholar]
- Penna, R. F., Sądowski, A., Kulkarni, A. K., & Narayan, R. 2013, MNRAS, 428, 2255 [NASA ADS] [CrossRef] [Google Scholar]
- Reid, M. J., Braatz, J. A., Condon, J. J., et al. 2009, ApJ, 695, 287 [Google Scholar]
- Reid, M. J., Braatz, J. A., Condon, J. J., et al. 2013, ApJ, 767, 154 [NASA ADS] [CrossRef] [Google Scholar]
- Reines, A. E., & Volonteri, M. 2015, ApJ, 813, 82 [NASA ADS] [CrossRef] [Google Scholar]
- Reynolds, C. S. 2019, Nat. Astron., 3, 41 [NASA ADS] [CrossRef] [Google Scholar]
- Sesana, A., Barausse, E., Dotti, M., & Rossi, E. M. 2014, ApJ, 794, 104 [NASA ADS] [CrossRef] [Google Scholar]
- Shakura, N. I., & Sunyaev, R. A. 1973, A&A, 24, 337 [NASA ADS] [Google Scholar]
- Shankar, F., Weinberg, D. H., & Miralda-Escudé, J. 2009, ApJ, 690, 20 [CrossRef] [Google Scholar]
- Soltan, A. 1982, MNRAS, 200, 115 [Google Scholar]
- Tarchi, A. 2012, in Cosmic Masers - from OH to H0, eds. R. S. Booth, W. H. T. Vlemmings, & E. M. L. Humphreys, IAU Symp., 287, 323 [Google Scholar]
- Volonteri, M., Sikora, M., Lasota, J. P., & Merloni, A. 2013, ApJ, 775, 94 [NASA ADS] [CrossRef] [Google Scholar]
- Yuan, F., Markoff, S., Falcke, H., & Biermann, P. L. 2002, A&A, 391, 139 [NASA ADS] [CrossRef] [EDP Sciences] [Google Scholar]
Appendix A: X-ray spectroscopy
In this section we briefly describe our own X-ray spectral analysis of both previously published and unpublished spectra. We used the same basic model components in order for the analysis to be as homogeneous as possible; this baseline model is composed of an absorbed power law, reprocessing from the torus (i.e., the Borus model, Baloković et al. 2018), which includes both cold reflection and fluorescence, and soft X-ray emission from a two-temperature hot plasma, possibly with a scattered power law mirroring the coronal power law. All these components are then absorbed by the Galactic column density, the amount of which was estimated for each source through the nh command in XSPEC (Kalberla et al. 2005). In the XSPEC notation, the baseline model is implemented as follows:
 (A.1)
(A.1)
When needed, a Gaussian line was added to the baseline model to fit the residuals at ∼1.7 − 1.8 keV, which we interpreted as either the Si Kα or Kβ emission line.
The log of the observations used in this analysis is presented in Table A.1. The XMM-Newton observations were reduced and products extracted with the SAS v1.3 software and relative standard tasks. The NuSTAR observations were reduced with the nupipeline v0.4.6 and nuproducts v0.3.0 tasks as part of the NuSTARDAS package. Unless otherwise specified, all the spectra were rebinned to have at least 20 counts per bin. The best-fit values of the parameters are shown in Table A.2. We note that we could significantly constrain the photon index only for NGC 2960, thanks to the broadband XMM-Newton + NuSTAR coverage. In the other cases, where only XMM-Newton data are available, the photon index was unconstrained and was fixed to a common value of Γ = 1.9.
Observation IDs considered for the X-ray spectral analysis.
A.1. NGC 2960
NGC 2960 is firmly detected by NuSTAR up to ∼30 keV. Its broadband (0.3 − 78 keV) spectrum was fit with the baseline model, with the addition of a cross-calibration constant, which takes into account the different calibration between the instruments and the possible flux variations due to the non-simultaneity of the XMM-Newton and NuSTAR observations. The spectrum is well fit (χ2/dof = 54/35) with the model, although a few residuals can be seen at the Fe Kα line energy at 6.4 keV, which may indicate that the obscuration and reflection derived from the fit are too low to explain the line prominence.
A.2. NGC 6264
The XMM-Newton spectrum is well fit by the baseline model. A residual at ∼1.8 keV is consistent with the emission of the Si Kβ line. The source is well within the Compton-thick regime of obscuration. In general, our parameters are consistent with those reported by Castangia et al. (2013).
A.3. NGC 6323
NGC 6323 is the faintest source in our sample, and due to the limited spectral quality we employed the Cash statistic (Cash 1979) during the fit. Its XMM-Newton spectrum is extremely flat at hard energies, showing a prominent Fe Kα line. Both these features are typical of a strong reflection component, which is likely reflection-dominated. The best-fit baseline model indeed requires a low covering factor (CF < 0.2) to better fit the flat spectral emission at 2 − 5 keV, and a very high column density as well. As a consequence, the intrinsic luminosity has to be very bright to produce the observed reprocessing features.
A.4. UGC 3789
Similarly to what was found for NGC 6264, the XMM-Newton spectrum is well fit by the baseline model. Residuals at ∼1.74 keV are consistent with the emission of the Si Kα line. Further residuals at soft energies may suggest that a simple two-temperature hot plasma is not suitable to explain the emission. In general, the derived parameters are consistent with the values reported by Castangia et al. (2013).
Results of the X-ray spectral analysis with the baseline model.
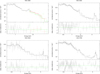 |
Fig. A.1. X-ray spectra fitted with the best-fit baseline model described in the text. In all the panels the black line refers to XMM-Newton PN data, while the red and green lines are NuSTAR focal plane modules A and B, respectively. All the spectra are heavily obscured, with prominent Fe Kα emission lines. |
All Tables
All Figures
|
Fig. 1. Bolometric luminosity–spin plane for the six megamasers considered in this work. In each panel the red line and area give the expected Lbol based on Eq. (4), while the value we adopted or measured is shown by the dashed black line (and its 1σ uncertainty in yellow). We also plot the bolometric luminosity as measured from the [OIII] line (Kuo et al. 2020) as dotted blue lines. In two cases (NGC 4258, UGC 3789) there is no formal solution between the expected and measured luminosities, while for NGC 6323 the two luminosities differ by more than an order of magnitude. |
| In the text | |
|
Fig. A.1. X-ray spectra fitted with the best-fit baseline model described in the text. In all the panels the black line refers to XMM-Newton PN data, while the red and green lines are NuSTAR focal plane modules A and B, respectively. All the spectra are heavily obscured, with prominent Fe Kα emission lines. |
| In the text | |
Current usage metrics show cumulative count of Article Views (full-text article views including HTML views, PDF and ePub downloads, according to the available data) and Abstracts Views on Vision4Press platform.
Data correspond to usage on the plateform after 2015. The current usage metrics is available 48-96 hours after online publication and is updated daily on week days.
Initial download of the metrics may take a while.