Fig. 1.
Download original image
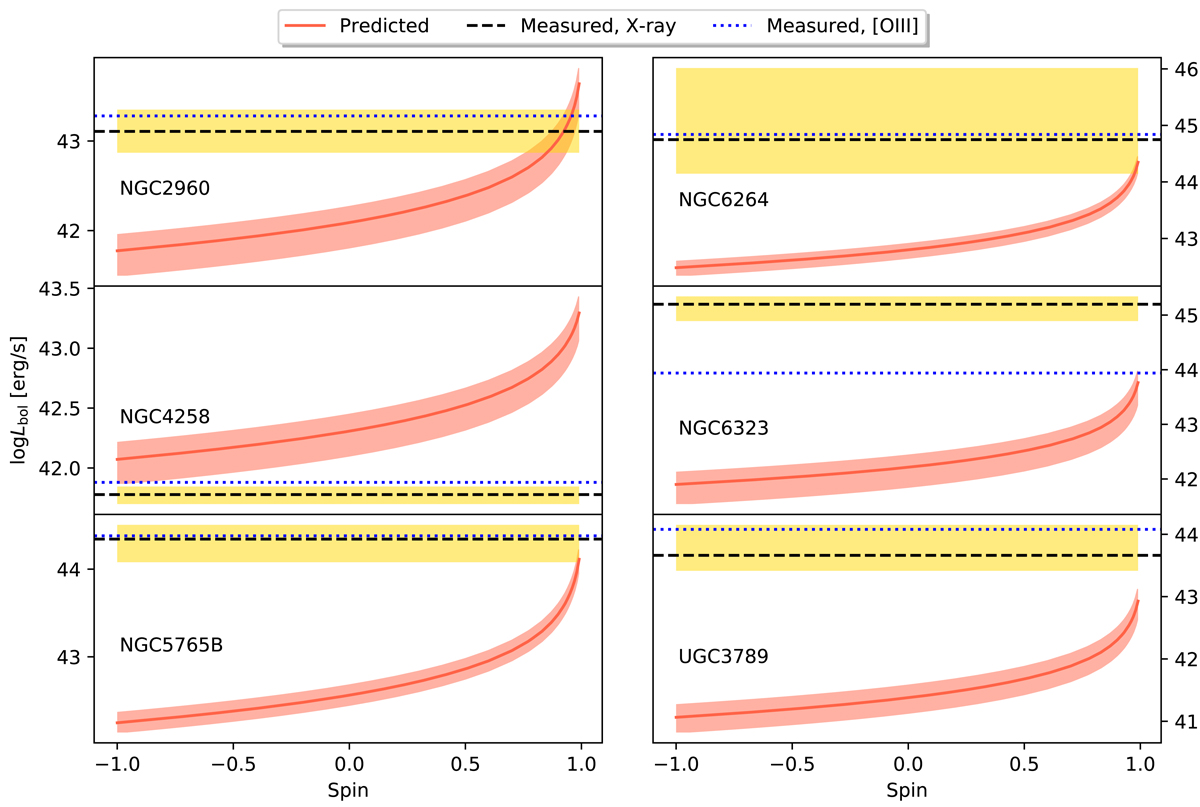
Bolometric luminosity–spin plane for the six megamasers considered in this work. In each panel the red line and area give the expected Lbol based on Eq. (4), while the value we adopted or measured is shown by the dashed black line (and its 1σ uncertainty in yellow). We also plot the bolometric luminosity as measured from the [OIII] line (Kuo et al. 2020) as dotted blue lines. In two cases (NGC 4258, UGC 3789) there is no formal solution between the expected and measured luminosities, while for NGC 6323 the two luminosities differ by more than an order of magnitude.
Current usage metrics show cumulative count of Article Views (full-text article views including HTML views, PDF and ePub downloads, according to the available data) and Abstracts Views on Vision4Press platform.
Data correspond to usage on the plateform after 2015. The current usage metrics is available 48-96 hours after online publication and is updated daily on week days.
Initial download of the metrics may take a while.