Fig. 4
Download original image
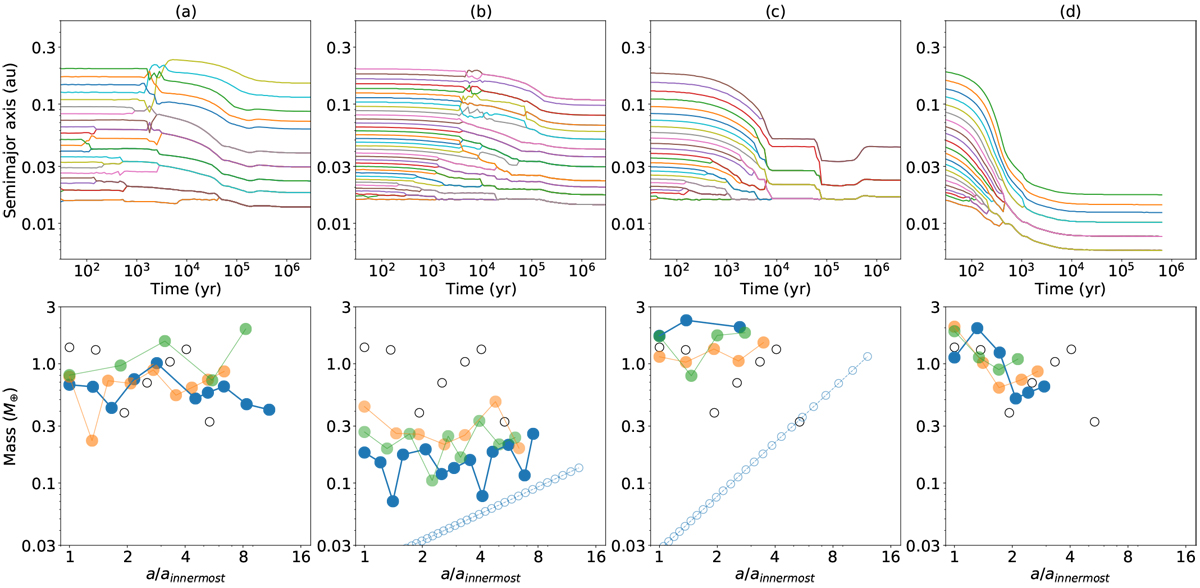
Temporal evolution of the semimajor axis for simulations with initial separation of Δ = 7 rH as inFig. 2 (top). Final mass distribution for simulations with Δ∕rH =7 (blue), 9 (orange), and 11 (green) as in Fig. 3 (bottom). In each simulation, we (a) delayed the start time, (b) reduced the initial total mass, (c) changed the index of the initial embryo distribution, (d) and used the disk evolution with lower turbulent viscosity.
Current usage metrics show cumulative count of Article Views (full-text article views including HTML views, PDF and ePub downloads, according to the available data) and Abstracts Views on Vision4Press platform.
Data correspond to usage on the plateform after 2015. The current usage metrics is available 48-96 hours after online publication and is updated daily on week days.
Initial download of the metrics may take a while.