Free Access
Fig. 4.
Download original image
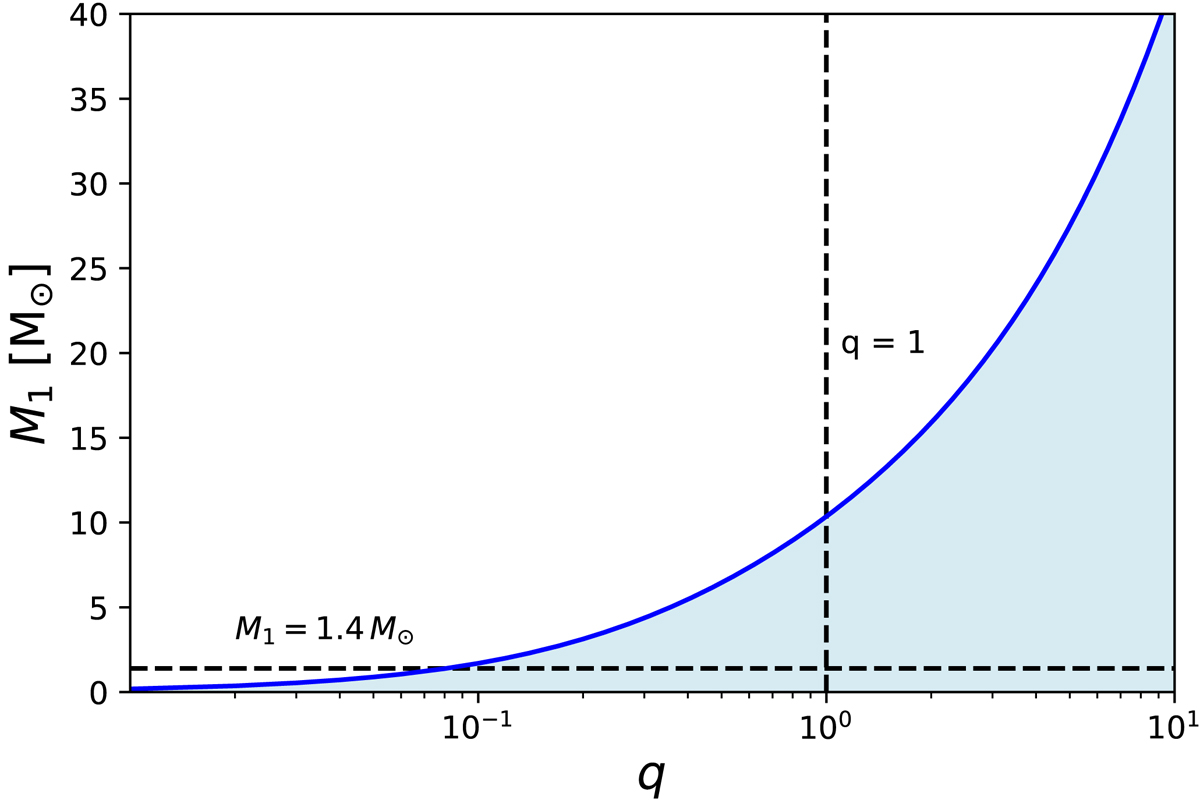
Relationship between the mass of the neutron star M1 and q drawn according to Eq. (25), as shown in blue line. The black horizontal solid line represents M1 = 1.4 M⊙ and the black vertical solid line shows q = 1. The blue area of this plot shows the area that matches the observation.
Current usage metrics show cumulative count of Article Views (full-text article views including HTML views, PDF and ePub downloads, according to the available data) and Abstracts Views on Vision4Press platform.
Data correspond to usage on the plateform after 2015. The current usage metrics is available 48-96 hours after online publication and is updated daily on week days.
Initial download of the metrics may take a while.