Fig. 7
Download original image
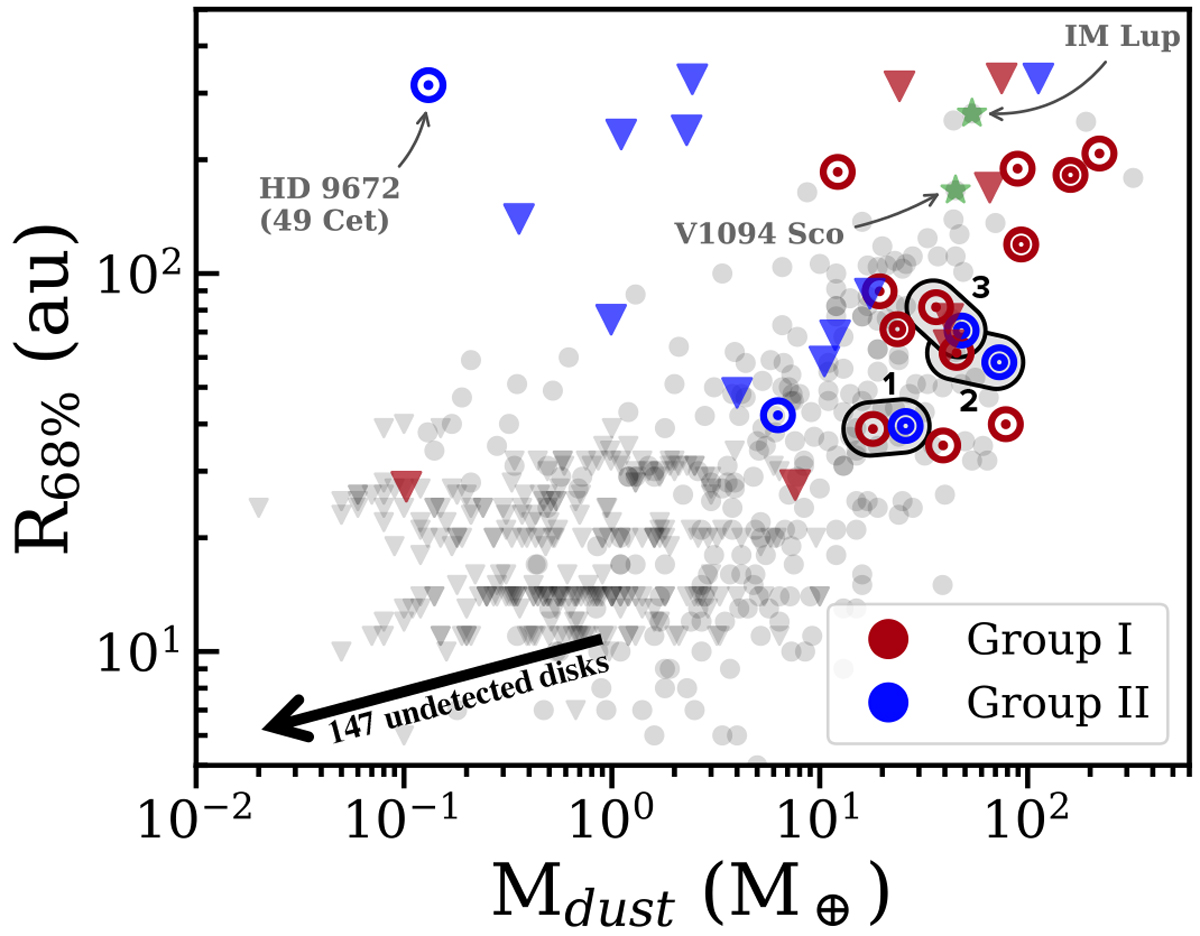
R68% radius plotted against the dust mass for the full sample in this work. Unlike Fig. 6, we use R68% values here for consistency with the work of van der Marel & Mulders (2021). The Herbig disks are divided into the Meeus et al. (2001) group I and II disks. disks with one (⊙) and two or more (⊚) (visible) rings are indicated as well. The upper limits on the radius are plotted as triangles. The grey scatter points and radius upper limits are the T Tauri disks of van der Marel & Mulders (2021). The large arrow shows the range of upper limits on the undetected disks. Three pairs of Herbig group I and II disks are circled and numbered 1-3; these are further discussed in Sect. 5.4 and Fig. 10. For extra context, the positions of the large T Tauri disks IM Lup and V1094 Sco are shown as green stars (Ansdell et al. 2016, 2018; van Terwisga et al. 2018; Cleeves et al. 2016).
Current usage metrics show cumulative count of Article Views (full-text article views including HTML views, PDF and ePub downloads, according to the available data) and Abstracts Views on Vision4Press platform.
Data correspond to usage on the plateform after 2015. The current usage metrics is available 48-96 hours after online publication and is updated daily on week days.
Initial download of the metrics may take a while.