Fig. 4
Download original image
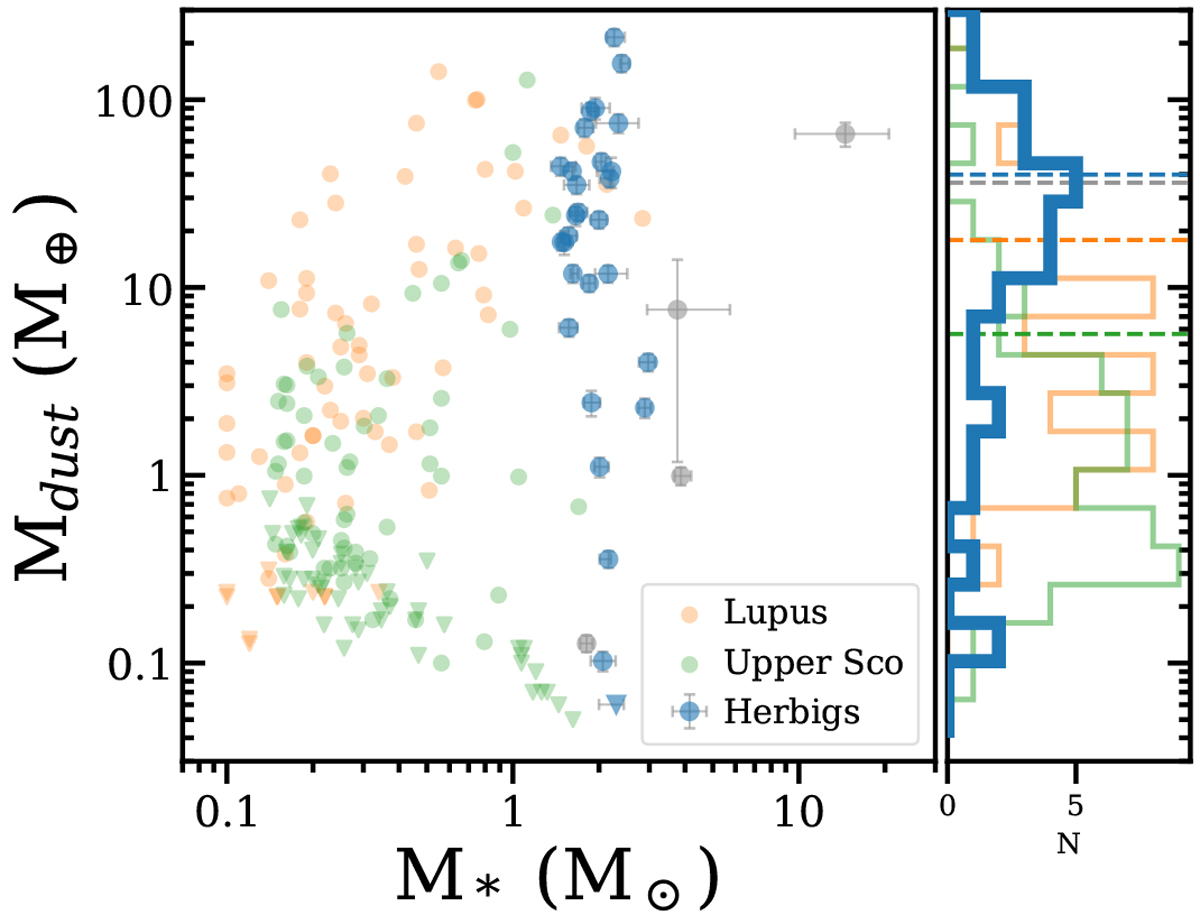
Stellar mass vs measured dust mass inside the disk. We show the dust masses of Upper Sco in green (Barenfeld et al. 2016), Lupus in orange (Ansdell et al. 2016), and the ALMA Herbig sample in blue. On the right a histogram is plotted of the distribution of the dust masses. The grey points are four of the six borderline stars (see Sect. 2). HD 53367 and Z CMa are missing because no stellar mass is available from Vioque et al. (2018) or Wichittanakom et al. (2020).
Current usage metrics show cumulative count of Article Views (full-text article views including HTML views, PDF and ePub downloads, according to the available data) and Abstracts Views on Vision4Press platform.
Data correspond to usage on the plateform after 2015. The current usage metrics is available 48-96 hours after online publication and is updated daily on week days.
Initial download of the metrics may take a while.