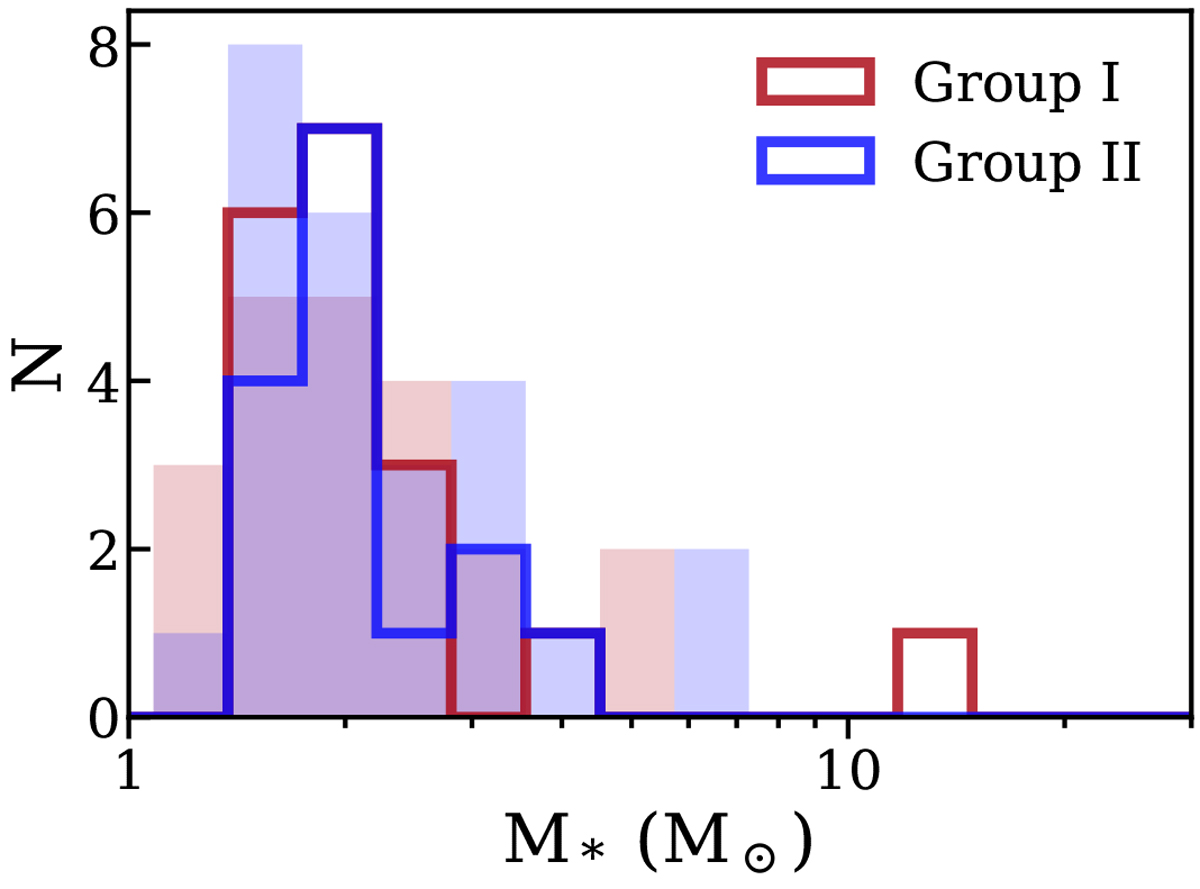
Fig. 11
Download original image
Stellar mass distribution of the groups I and II objects used in this work. The shaded histogram shows the distribution of stellar masses for both the group I and group II objects not observed with ALMA within 450 pc.
Current usage metrics show cumulative count of Article Views (full-text article views including HTML views, PDF and ePub downloads, according to the available data) and Abstracts Views on Vision4Press platform.
Data correspond to usage on the plateform after 2015. The current usage metrics is available 48-96 hours after online publication and is updated daily on week days.
Initial download of the metrics may take a while.