Fig. 10
Download original image
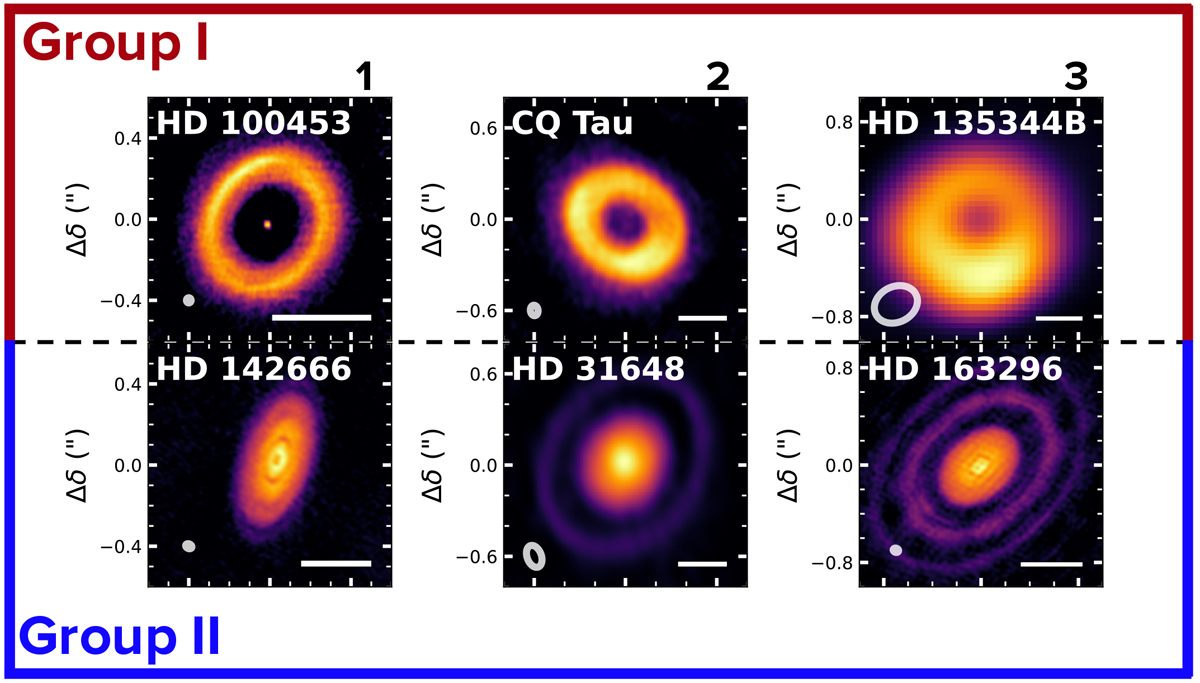
Three resolved disks for both group I and group II with similar extent and mass for each pair of disks. Each image is normalized with an asinh stretch to increase the visibility of the fainter details of the disk. A 50 au scale bar is shown to the bottom right of each image.
Current usage metrics show cumulative count of Article Views (full-text article views including HTML views, PDF and ePub downloads, according to the available data) and Abstracts Views on Vision4Press platform.
Data correspond to usage on the plateform after 2015. The current usage metrics is available 48-96 hours after online publication and is updated daily on week days.
Initial download of the metrics may take a while.