Open Access
Fig. 8
Download original image
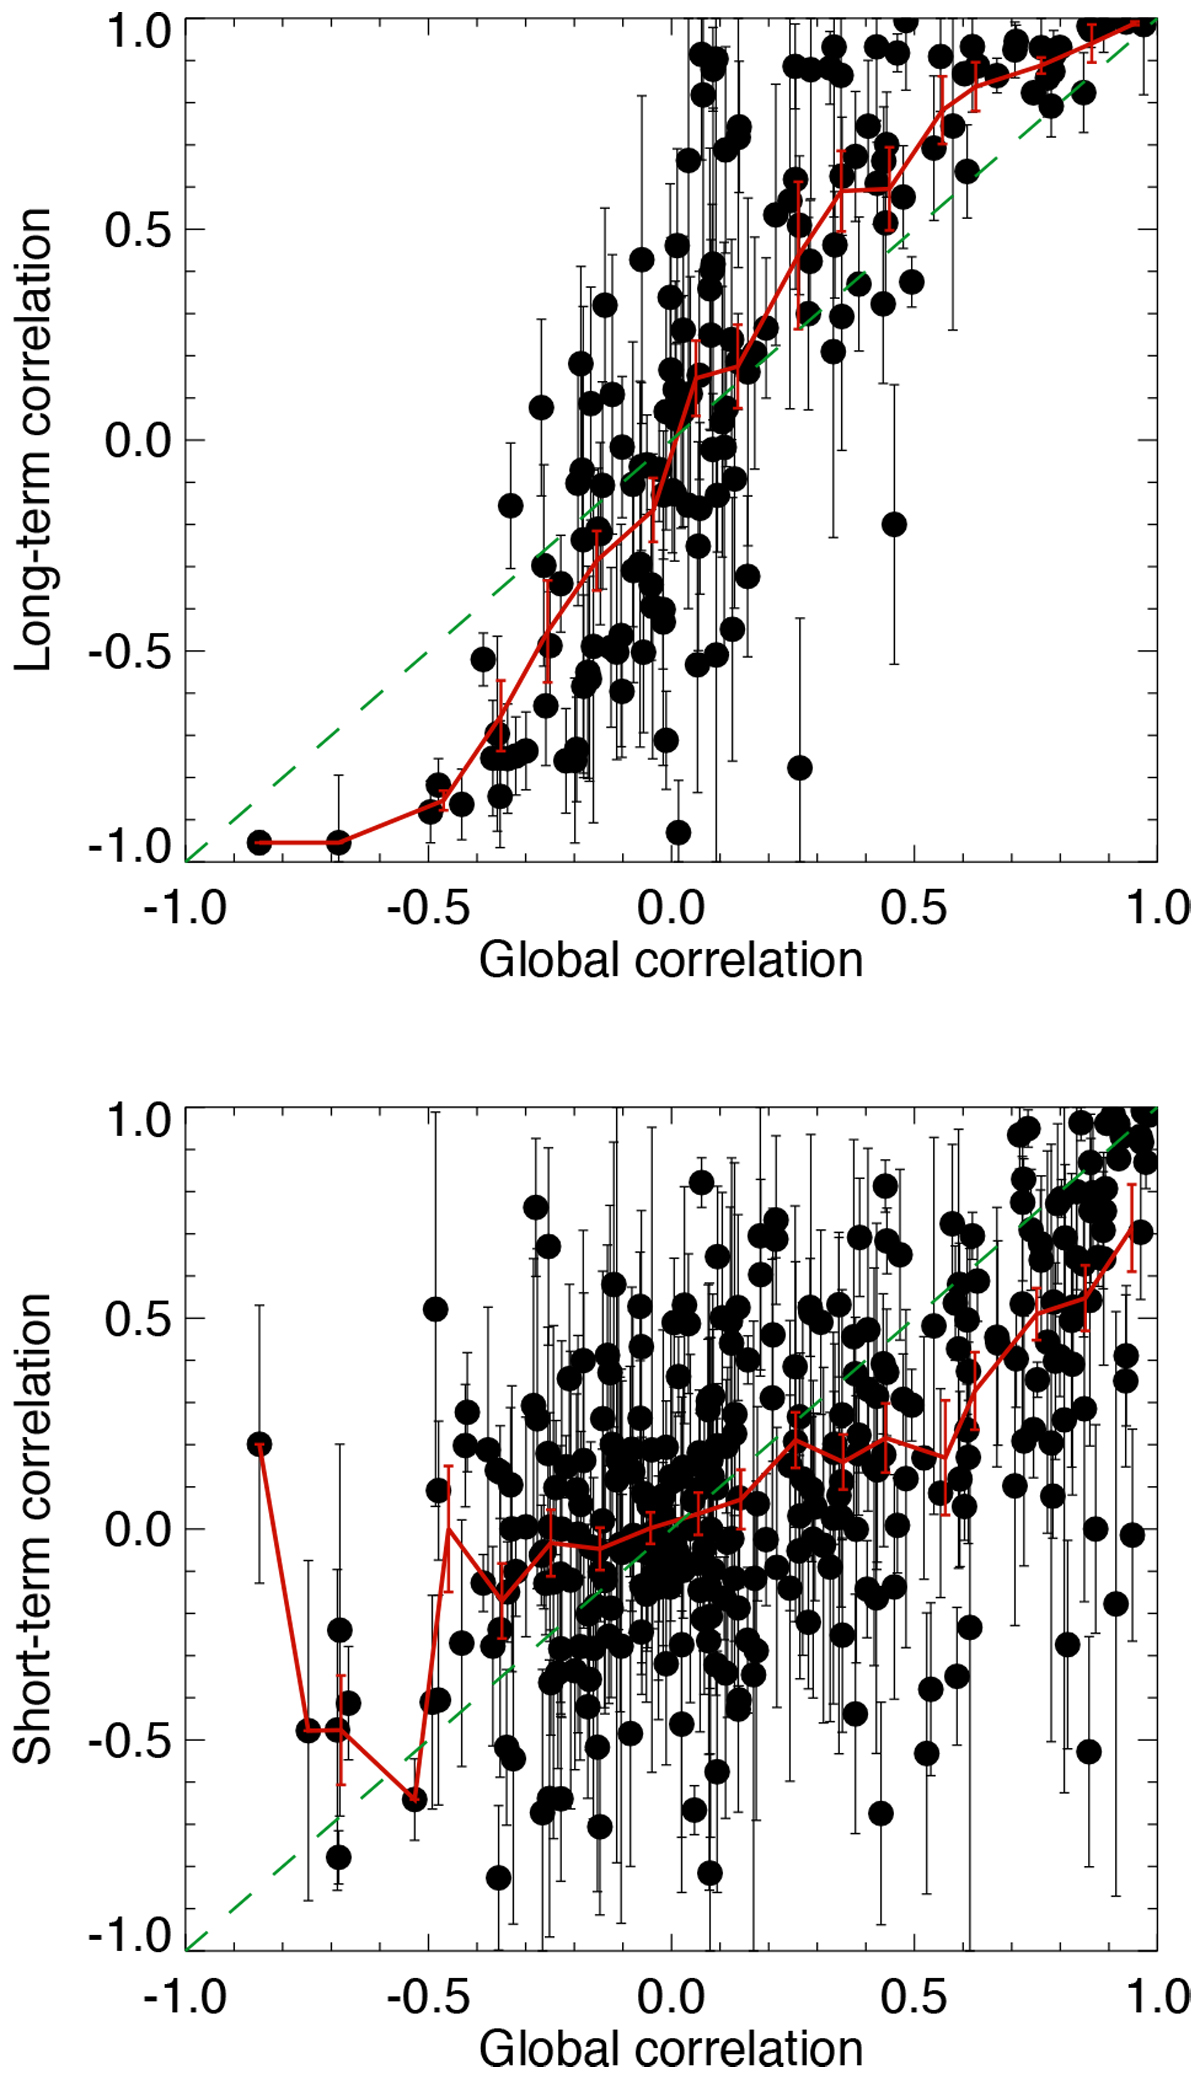
Upper panel: LT correlation versus global correlation (black). Bins in global correlation of 0.1 in width are defined, and LT correlations are averaged over each bin (red line). The green dashed line is the y = x line. Lower panel: same for the ST correlation.
Current usage metrics show cumulative count of Article Views (full-text article views including HTML views, PDF and ePub downloads, according to the available data) and Abstracts Views on Vision4Press platform.
Data correspond to usage on the plateform after 2015. The current usage metrics is available 48-96 hours after online publication and is updated daily on week days.
Initial download of the metrics may take a while.