Open Access
Fig. D.2
Download original image
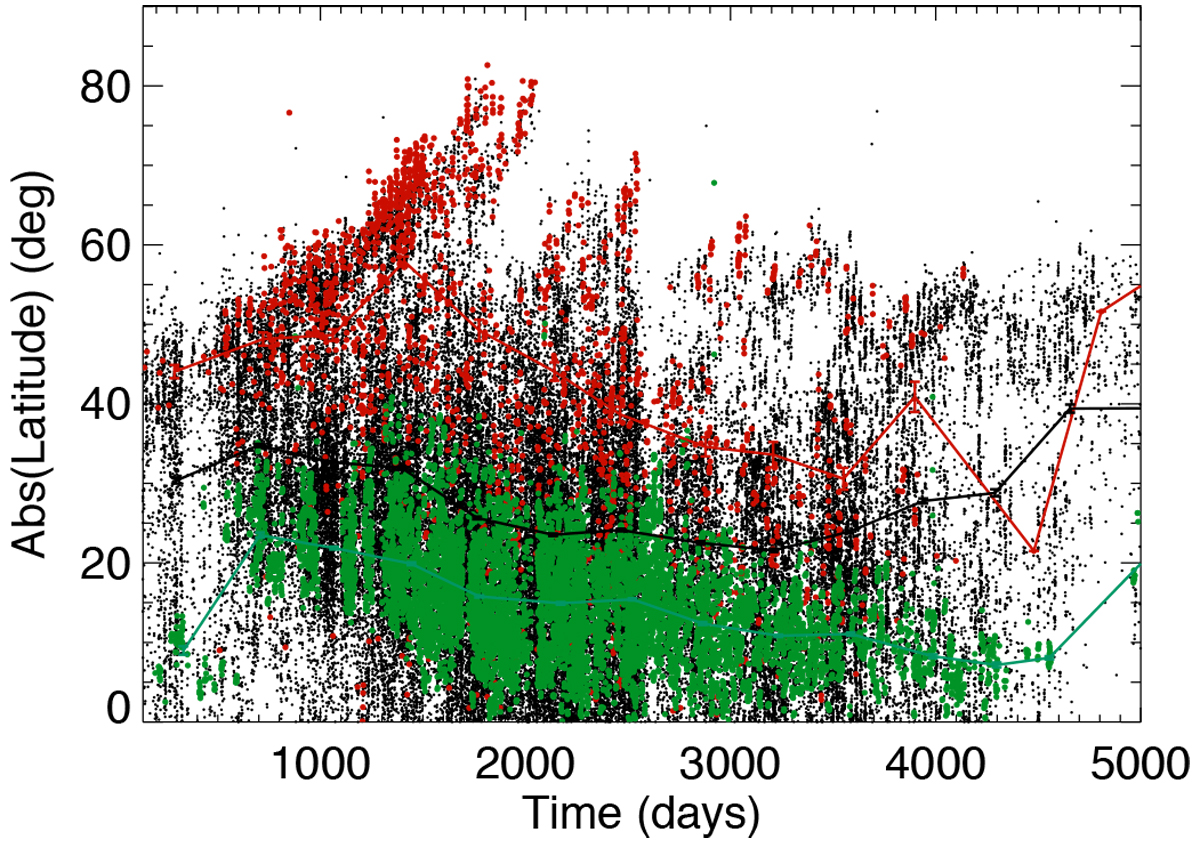
Butterfly diagram (folded between the two hemispheres) of plages (green) from MDI/SOHO, small filaments (black) and large filaments (red) from the BASS2000 data base, defined with a threshold of 50°2. The solid lines correspond to a binning over 1 year.
Current usage metrics show cumulative count of Article Views (full-text article views including HTML views, PDF and ePub downloads, according to the available data) and Abstracts Views on Vision4Press platform.
Data correspond to usage on the plateform after 2015. The current usage metrics is available 48-96 hours after online publication and is updated daily on week days.
Initial download of the metrics may take a while.