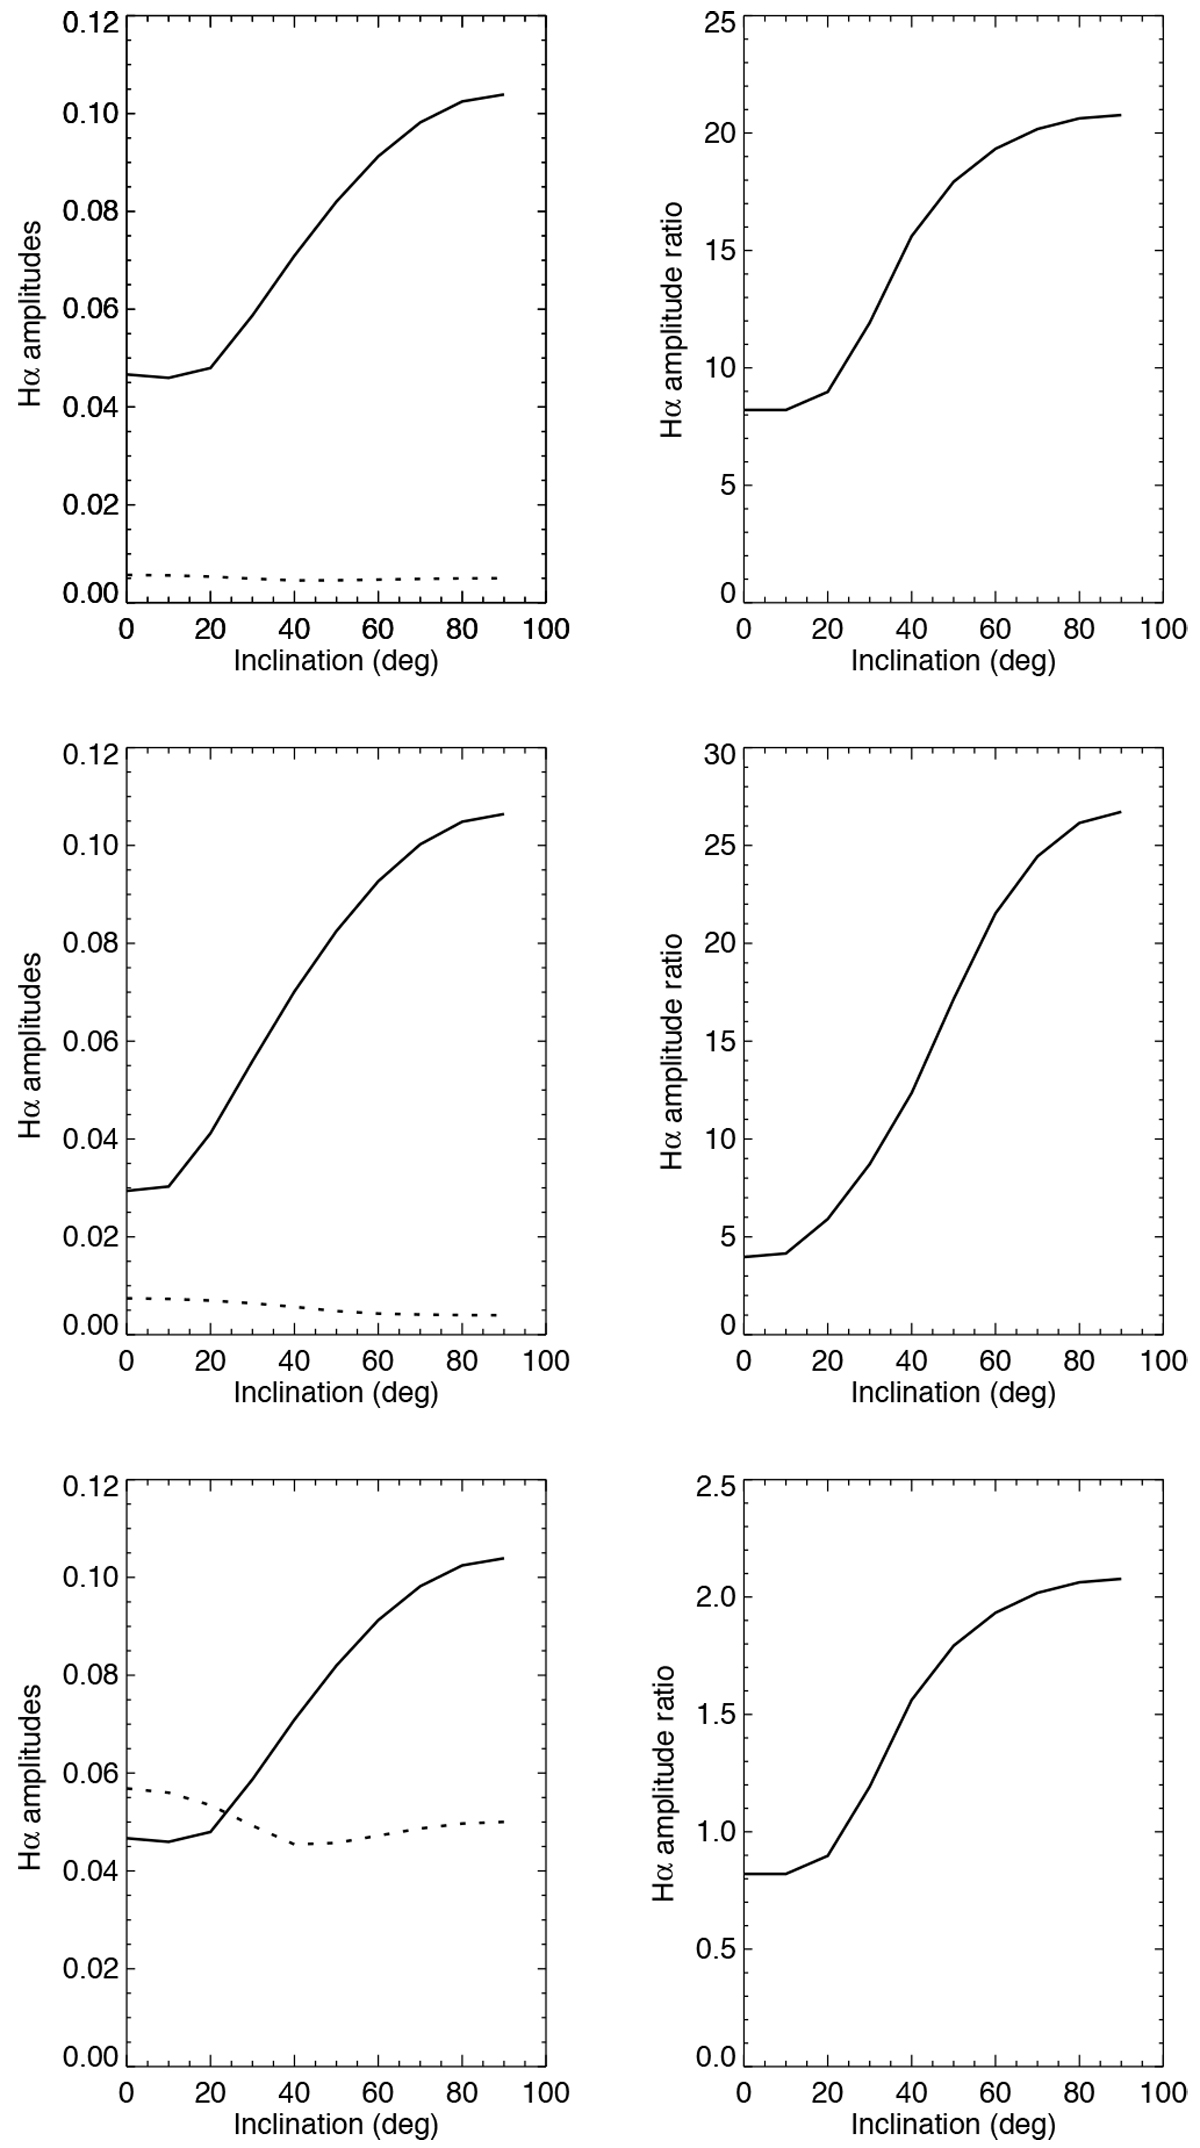
Fig. D.1
Download original image
Hα amplitude (right panels) versus inclination due to plages (solid line) and filaments (dashed line), and ratio between plage and filament amplitudes (left panels) for different configurations: average solar latitude (LT1 in Table 6) and r=10 (upper panels), stronger latitude differences (LT2) and r=10 (middle panels), and average solar latitude and r=1 (lower panels).
Current usage metrics show cumulative count of Article Views (full-text article views including HTML views, PDF and ePub downloads, according to the available data) and Abstracts Views on Vision4Press platform.
Data correspond to usage on the plateform after 2015. The current usage metrics is available 48-96 hours after online publication and is updated daily on week days.
Initial download of the metrics may take a while.