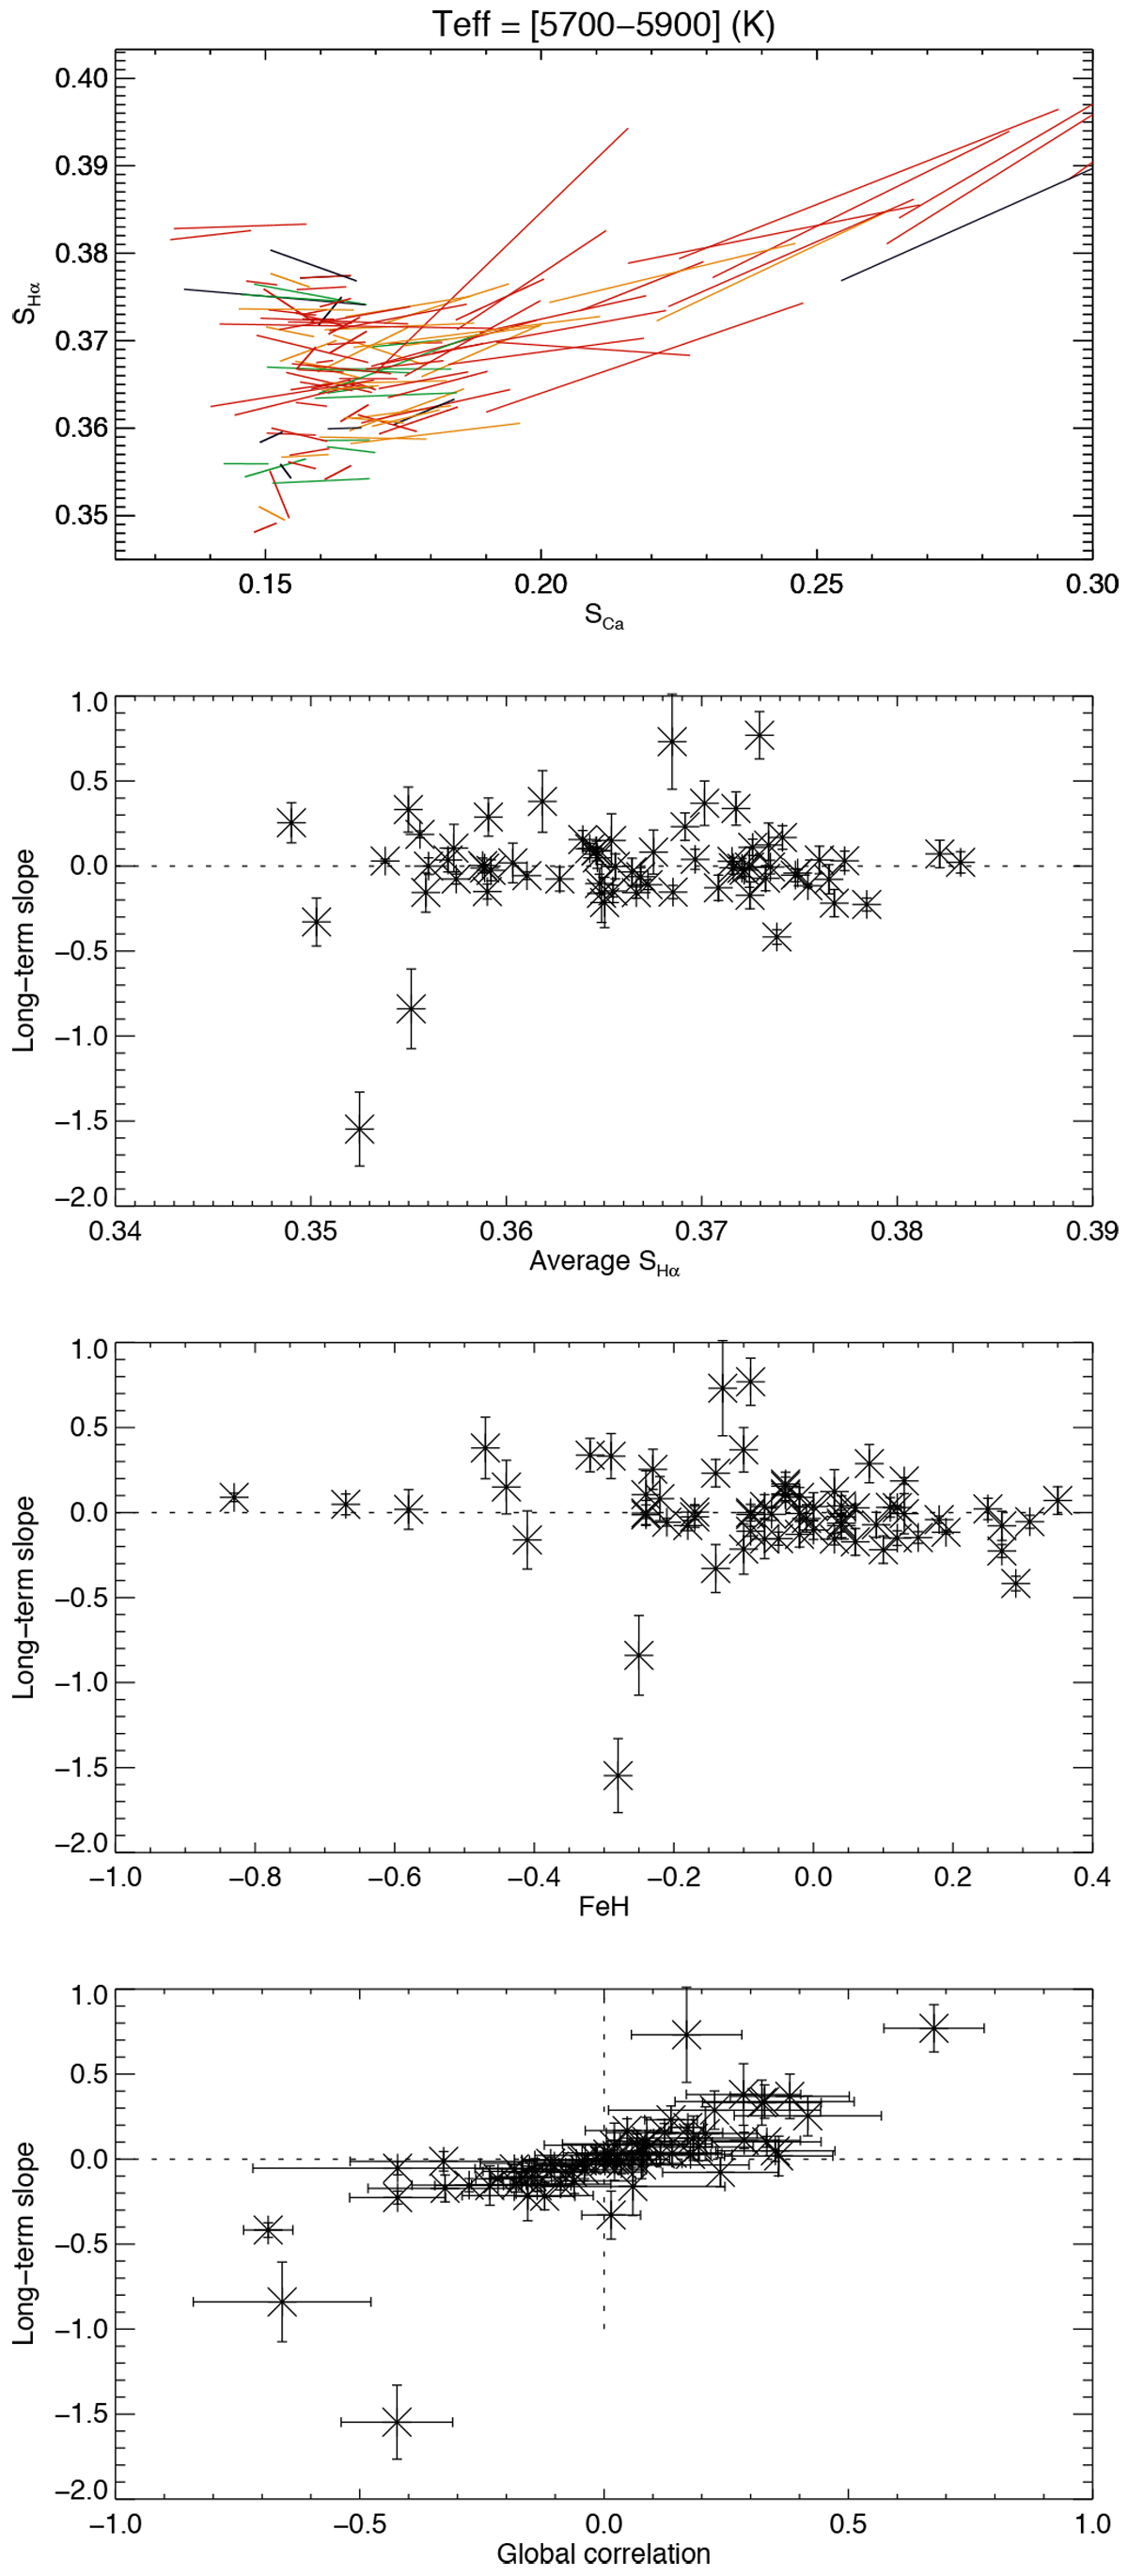
Fig. C.3
Download original image
First panel: Linear fits on SHα versus SCa, for the observed coverage in SCa. The colour code corresponds to the number of nights for each star: between 10 and 20 nights (black), between 20 and 50 nights (red), between 50 and 100 nights (orange), and higher than 100 (green). Second panel: Slope (SH α versus SCa) versus average SHα for quiet stars (SCa below 0.17) with Teff in the 5700-5900 K range (upper panel). Third panel: Same versus metallicity. Fourth panel: Same versus global correlation.
Current usage metrics show cumulative count of Article Views (full-text article views including HTML views, PDF and ePub downloads, according to the available data) and Abstracts Views on Vision4Press platform.
Data correspond to usage on the plateform after 2015. The current usage metrics is available 48-96 hours after online publication and is updated daily on week days.
Initial download of the metrics may take a while.