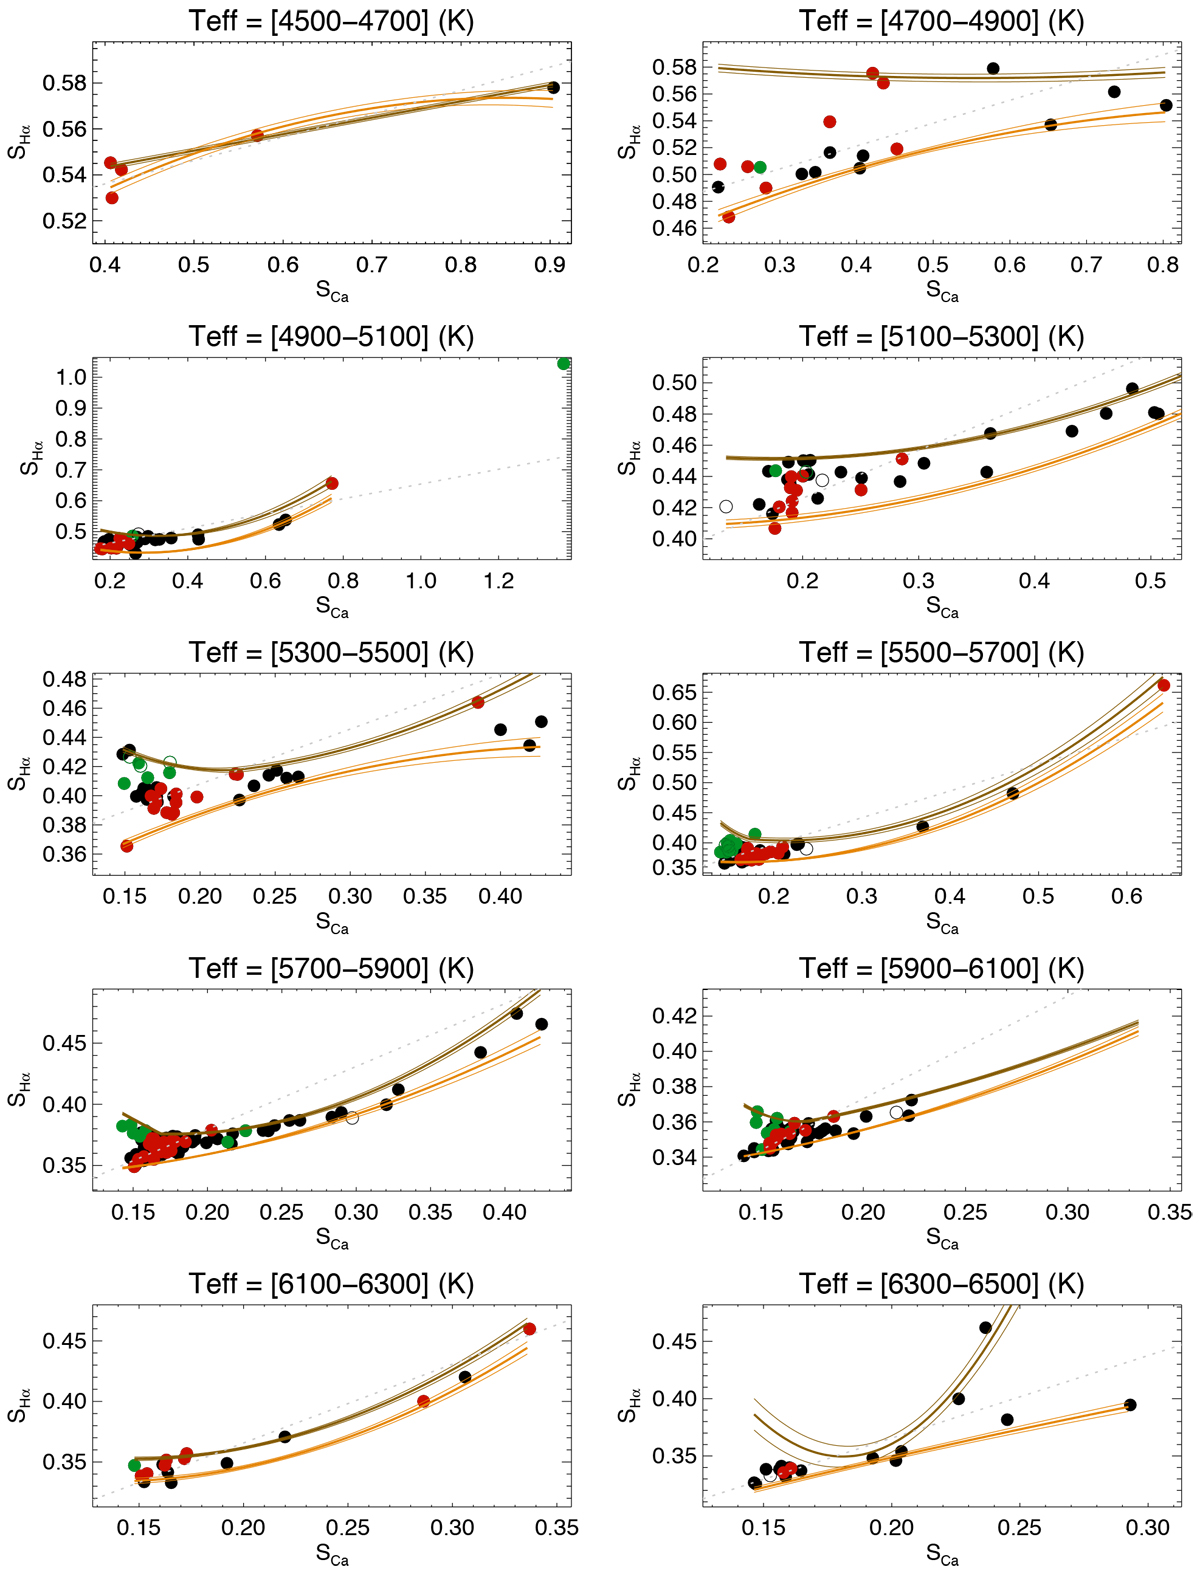
Fig. C.2
Download original image
Same as Fig. 4 but for the whole range of activity levels. The curves in orange (lower bound) and brown (upper bound) are used to define the laws relating the Hα emission in plage to the Ca II emission in hypothesis B. The thick lines are the main laws used inthe analysis, while the two thin lines of each colour correspond to the uncertainty.
Current usage metrics show cumulative count of Article Views (full-text article views including HTML views, PDF and ePub downloads, according to the available data) and Abstracts Views on Vision4Press platform.
Data correspond to usage on the plateform after 2015. The current usage metrics is available 48-96 hours after online publication and is updated daily on week days.
Initial download of the metrics may take a while.