Fig. C.1
Download original image
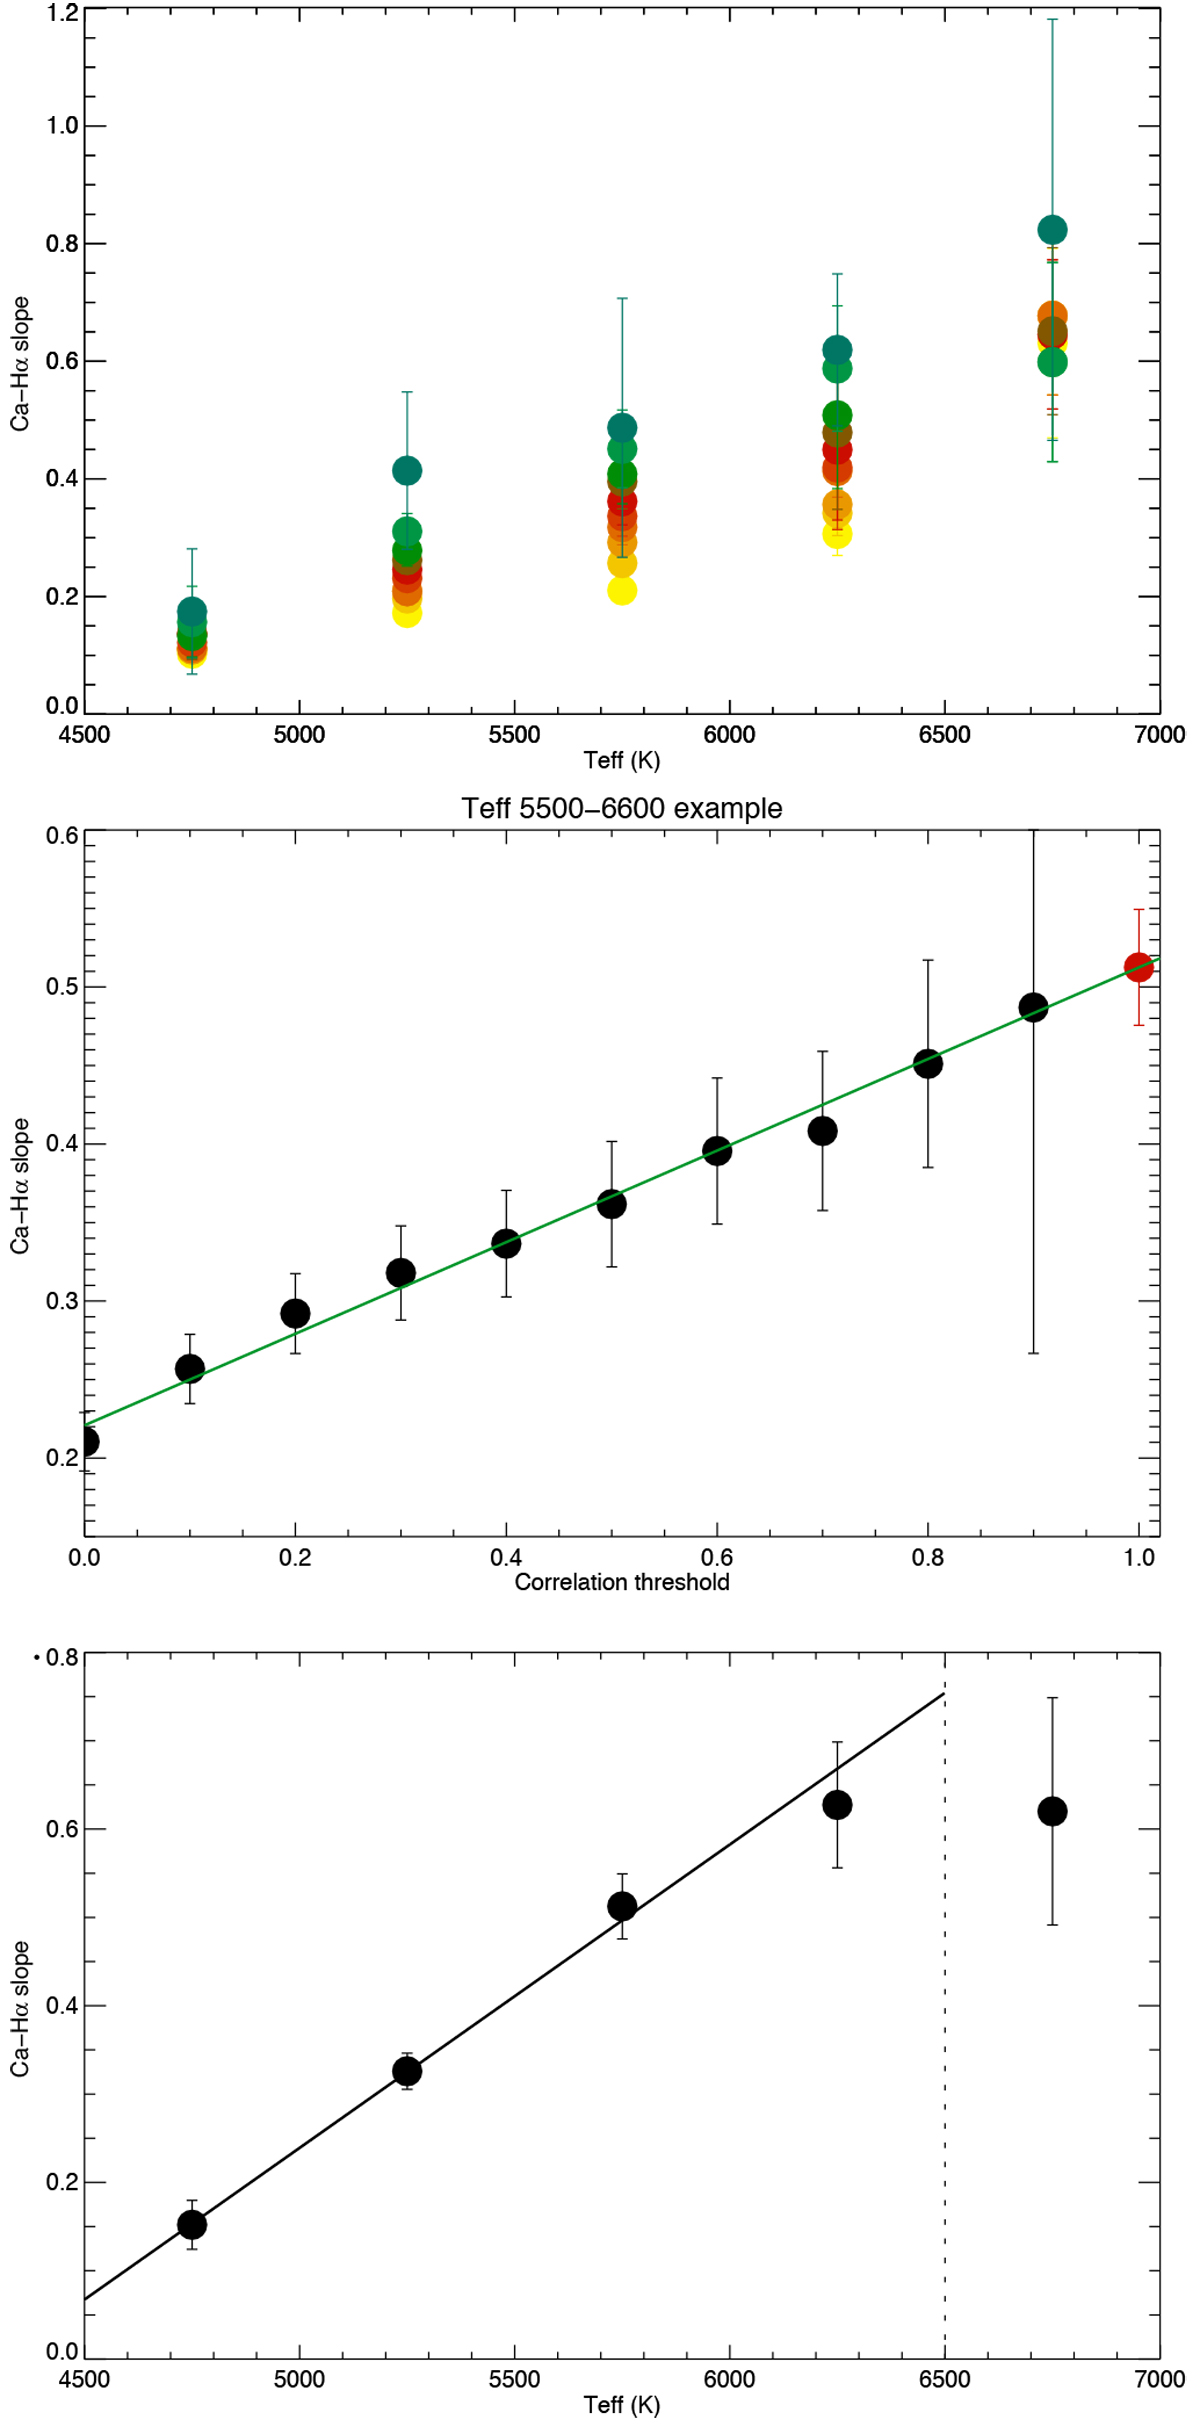
Upper panel: Slope between SHα and SCa binned in Teff, for different thresholds in correlation between 0 (yellow) and 0.9 (blue). Middle panel: Slope versus correlation threshold for the bin 5500-6000 K, in black. The red dot corresponds to the extrapolation at a correlation of 1. Lower panel: Extrapolated slope for a correlation of 1 versus Teff.
Current usage metrics show cumulative count of Article Views (full-text article views including HTML views, PDF and ePub downloads, according to the available data) and Abstracts Views on Vision4Press platform.
Data correspond to usage on the plateform after 2015. The current usage metrics is available 48-96 hours after online publication and is updated daily on week days.
Initial download of the metrics may take a while.