Open Access
Fig. 14
Download original image
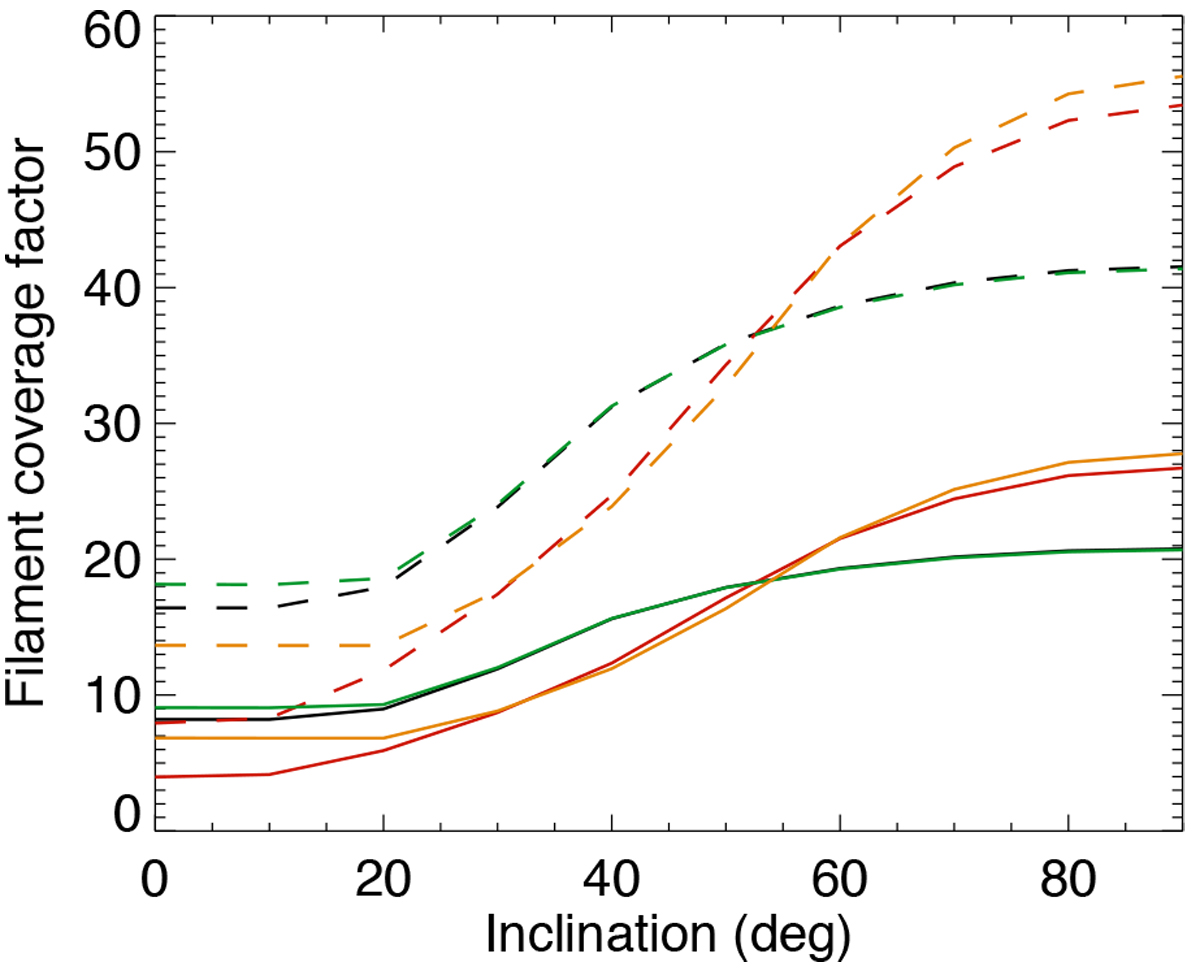
Factor necessary for filaments to compensate (solid lines) for the plage emission (in Hα) vs. inclination, for different configurations (Table 6): LT1 (black), LT2 (red), LT3 (green), LT4 (orange). The dashed lines correspond to a filament contribution to the Hα emission twice larger than the plage contribution (see text).
Current usage metrics show cumulative count of Article Views (full-text article views including HTML views, PDF and ePub downloads, according to the available data) and Abstracts Views on Vision4Press platform.
Data correspond to usage on the plateform after 2015. The current usage metrics is available 48-96 hours after online publication and is updated daily on week days.
Initial download of the metrics may take a while.