Fig. 11
Download original image
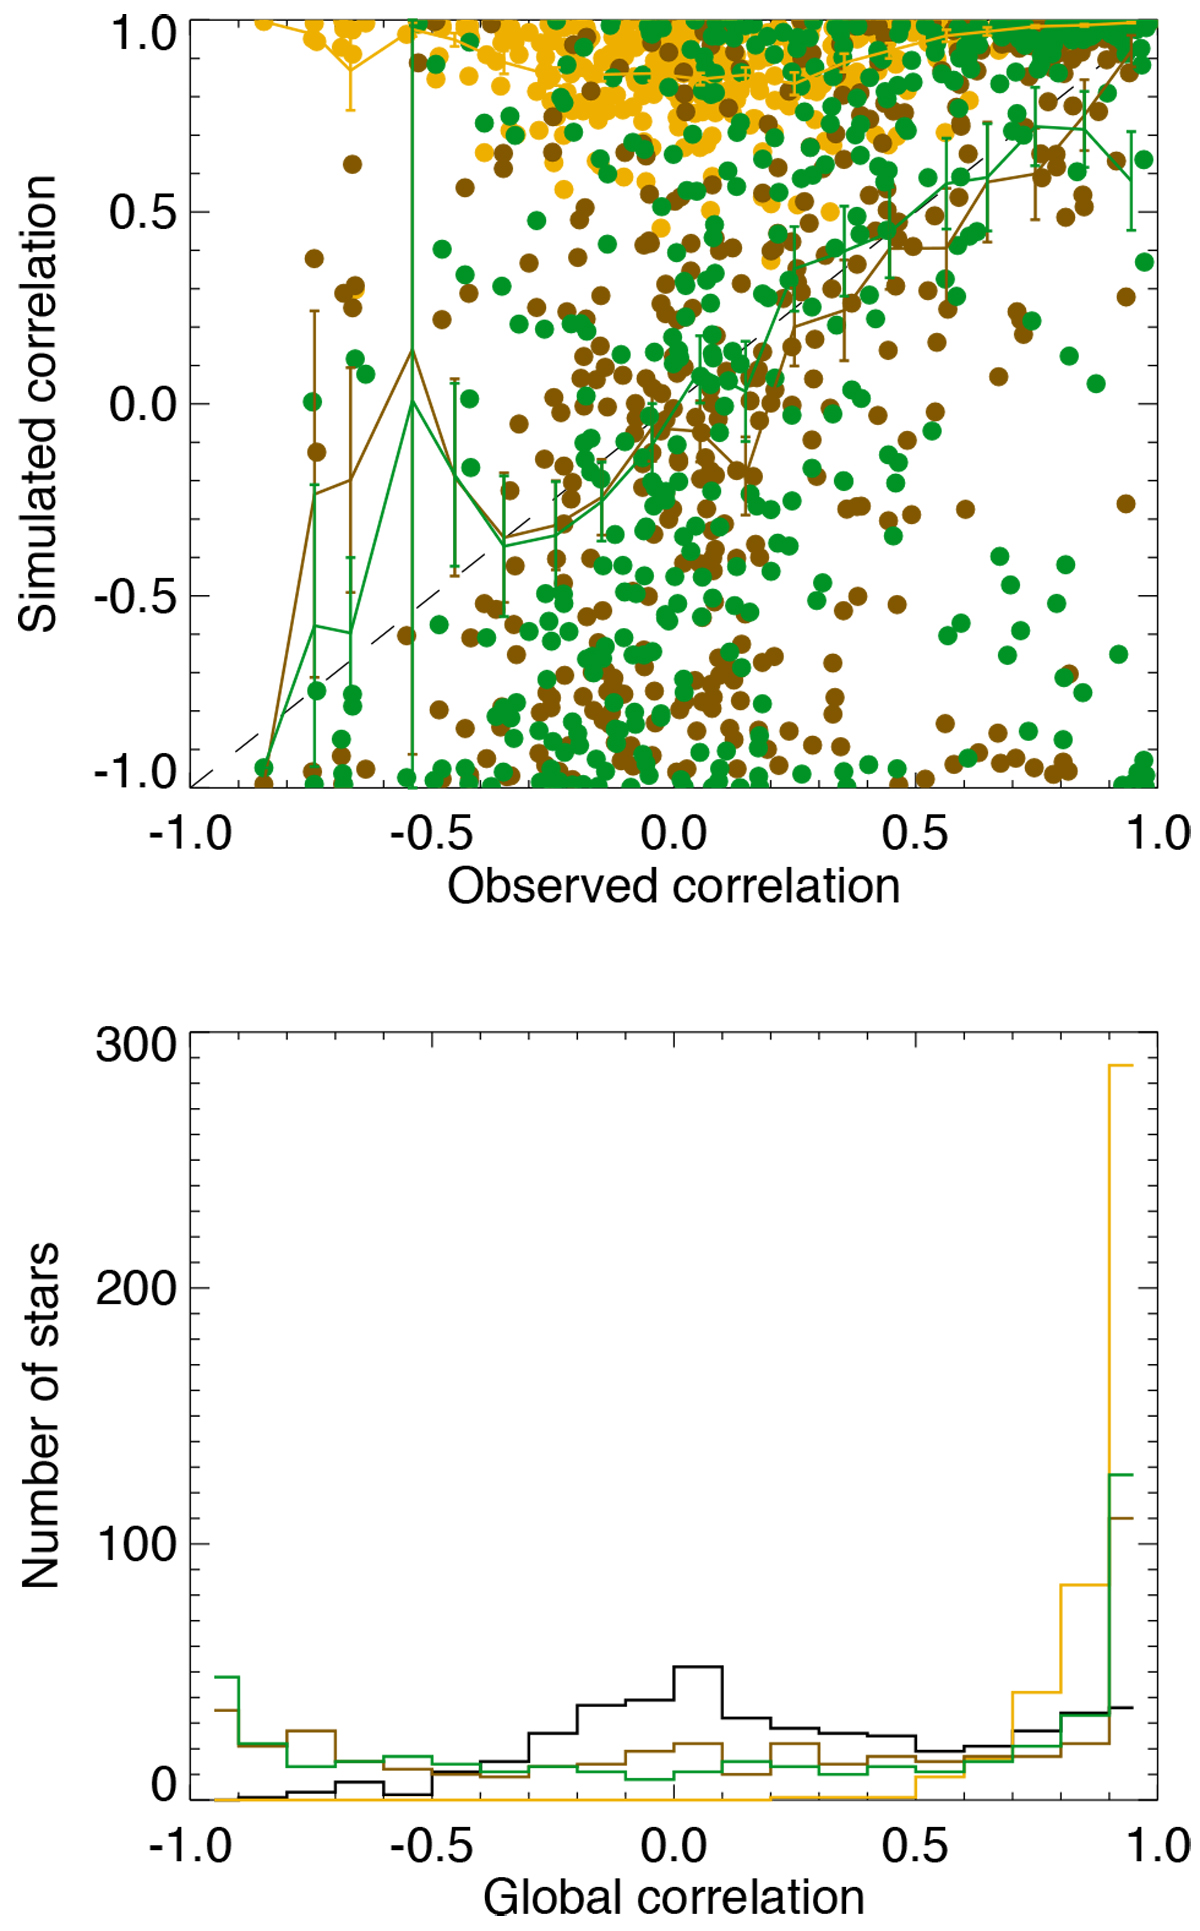
Upper panel: simulated global correlation (Hα reconstructed from observed Ca II) for all stars versus observed correlation, for hypothesis A (orange), hypothesis B (brown), and hypothesis C (green). Lower panel: distribution of global correlation: observed (black), hypothesis A (orange), hypothesis B (brown), and hypothesis C (green).
Current usage metrics show cumulative count of Article Views (full-text article views including HTML views, PDF and ePub downloads, according to the available data) and Abstracts Views on Vision4Press platform.
Data correspond to usage on the plateform after 2015. The current usage metrics is available 48-96 hours after online publication and is updated daily on week days.
Initial download of the metrics may take a while.