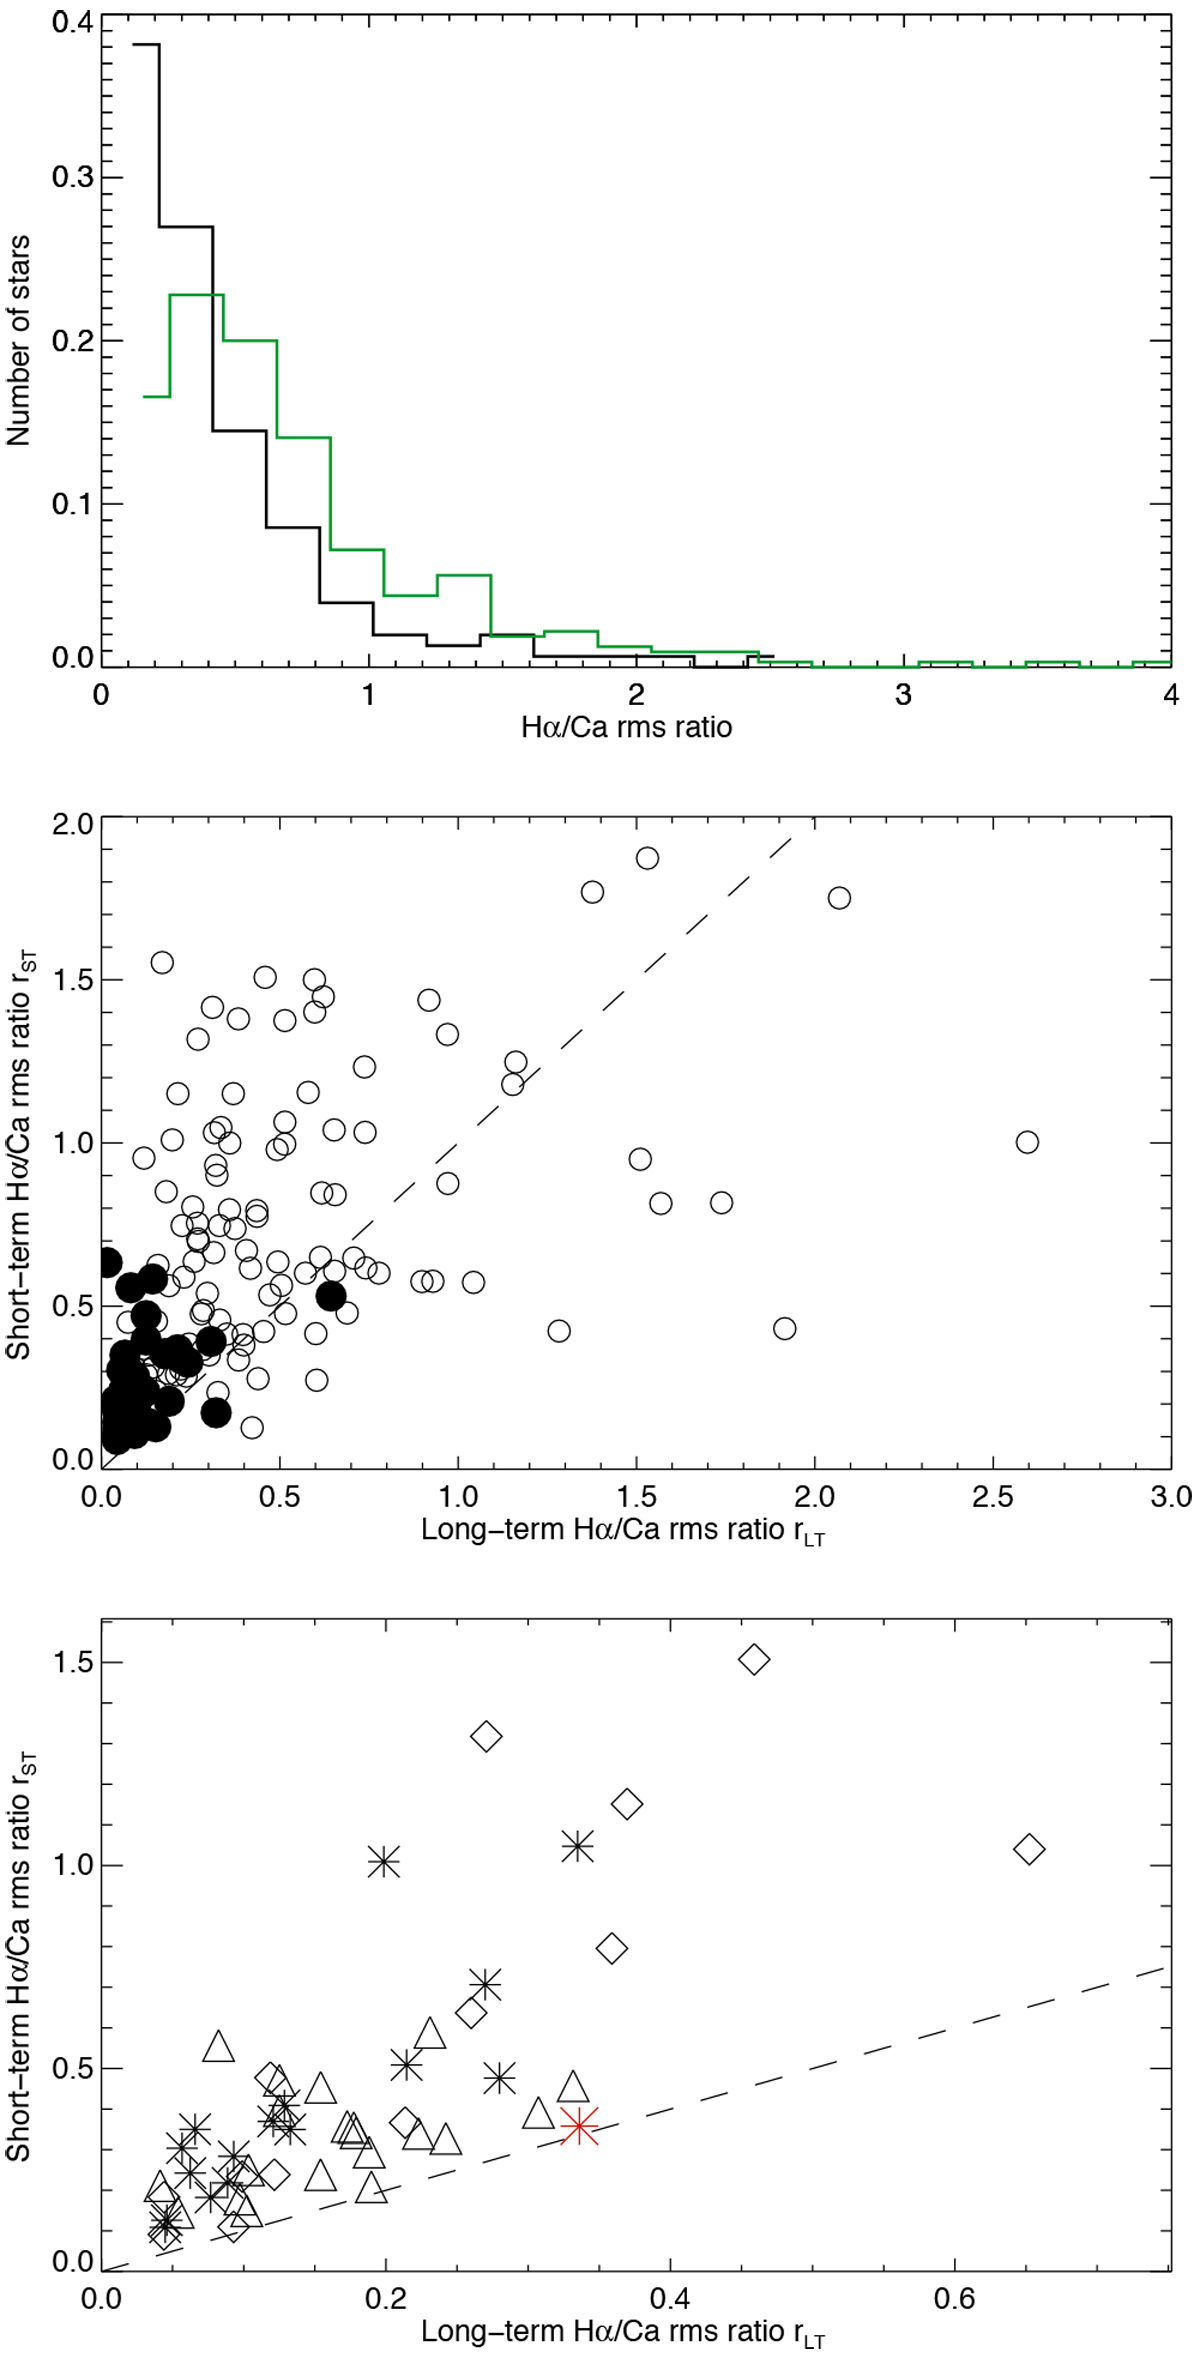
Fig. 10
Download original image
Upper panel: distribution of ratios between Hα and Ca II rms emissions, rLT (black), and rST (green). The last one can reach values up to 7.1, but the plot has been cut to ratios of at most 4 for clarity, as there are very few stars with a higher ratio. Middle panel: ST rms ratio versus LT rms ratio (for stars common to the two subsamples), for stars with high LT Ca amplitude (rms > 0.01, filled circles), and stars with a lower LT variability (open circles). The dashed line is the y = x line. Lower panel: same for stars in category #1 (stars), category #2 (diamonds), and category #3 (triangles). The Sun is indicated by the red star.
Current usage metrics show cumulative count of Article Views (full-text article views including HTML views, PDF and ePub downloads, according to the available data) and Abstracts Views on Vision4Press platform.
Data correspond to usage on the plateform after 2015. The current usage metrics is available 48-96 hours after online publication and is updated daily on week days.
Initial download of the metrics may take a while.