Open Access
Fig. 9.
Download original image
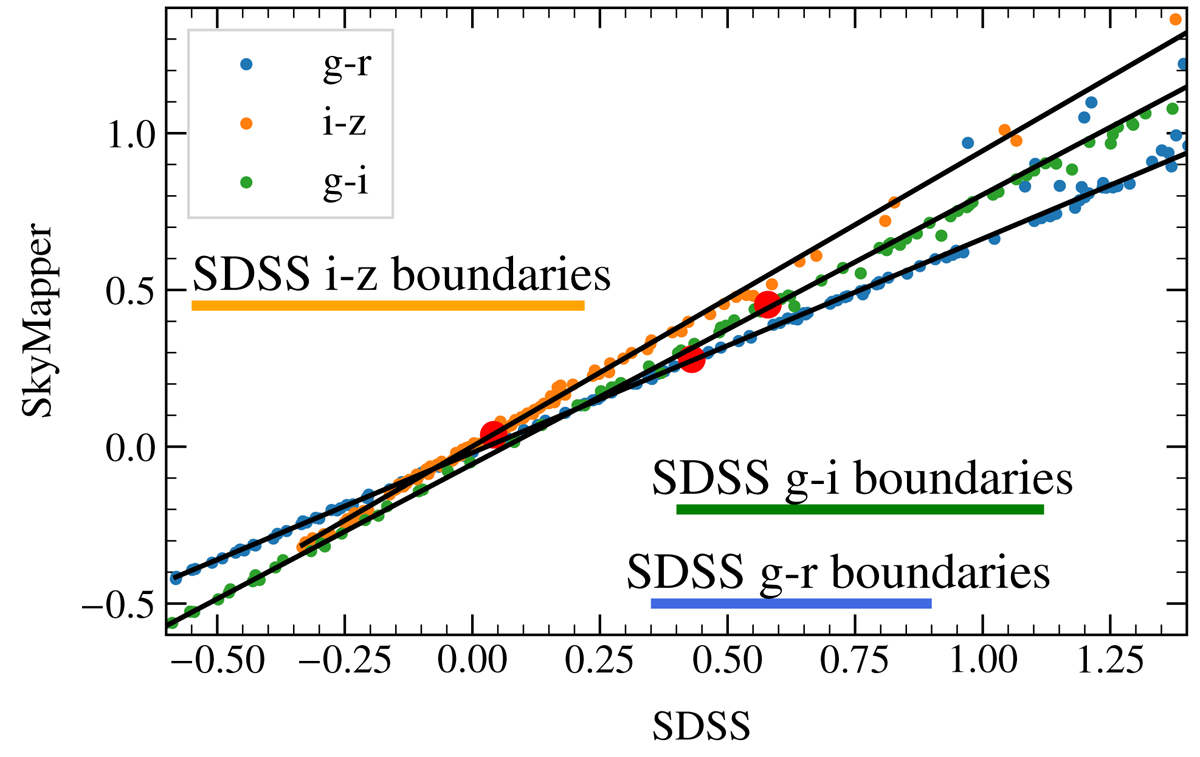
g − r (blue), g − i (green), and i − z (orange) colors from the SDSS compared with SkyMapper for a wide range of stellar classes. Red dots represent the colors of the Sun (Holmberg et al. 2006). The colored horizontal lines illustrate the range of colors for the SDSS asteroid taxonomy (Sergeyev & Carry 2021).
Current usage metrics show cumulative count of Article Views (full-text article views including HTML views, PDF and ePub downloads, according to the available data) and Abstracts Views on Vision4Press platform.
Data correspond to usage on the plateform after 2015. The current usage metrics is available 48-96 hours after online publication and is updated daily on week days.
Initial download of the metrics may take a while.